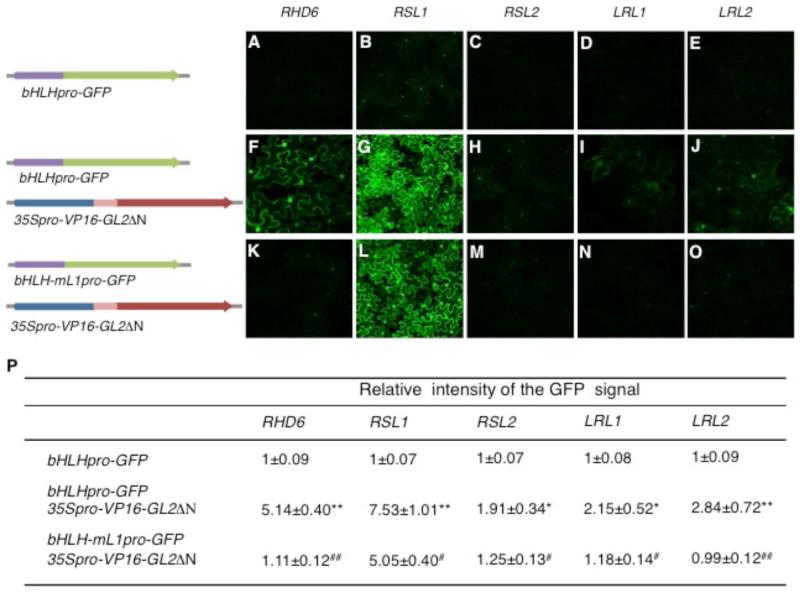
Figure 3.
Transient Expression Analysis for the Promoter Activity Directed by VP16-GL2ΔN.
(A) to (O) Representative fluorescence images of the N. benthamiana leaf epidermis transfected with each bHLH promoter-driven GFP gene, bHLHpro-GFP (A to E), each bHLHpro-GFP and the trans-factor gene 35Spro-VP16-GL2ΔN (F to J), or each mutant bHLH promoter-driven GFP gene, bHLH-mL1pro-GFP, and 35Spro-VP16-GL2ΔN (K to O) are shown. The structures of the genes are schematically illustrated on the left of the images. The L1 box-like sequence 5’-TAAATGT-3’ was altered to 5’-TACATCT-3’ at all sites in each mutant bHLH promoter.
(P) Intensities of the GFP fluorescence signal were quantified and the relative intensity of the signal was calculated with the mean value for each bHLHpro-GFP arbitrarily set as 1 (mean ± s.d., n = 3). Asterisks indicate that the values are significantly different from their corresponding bHLHpro-GFP values (* P < 0.05, ** P < 0.01, Student’s t-test). Hashes indicate that the values are significantly different from their corresponding bHLHpro-GFP/35Spro-VP16-GL2ΔN values (# P< 0.05; ## P< 0.01, Student’s t-test).

