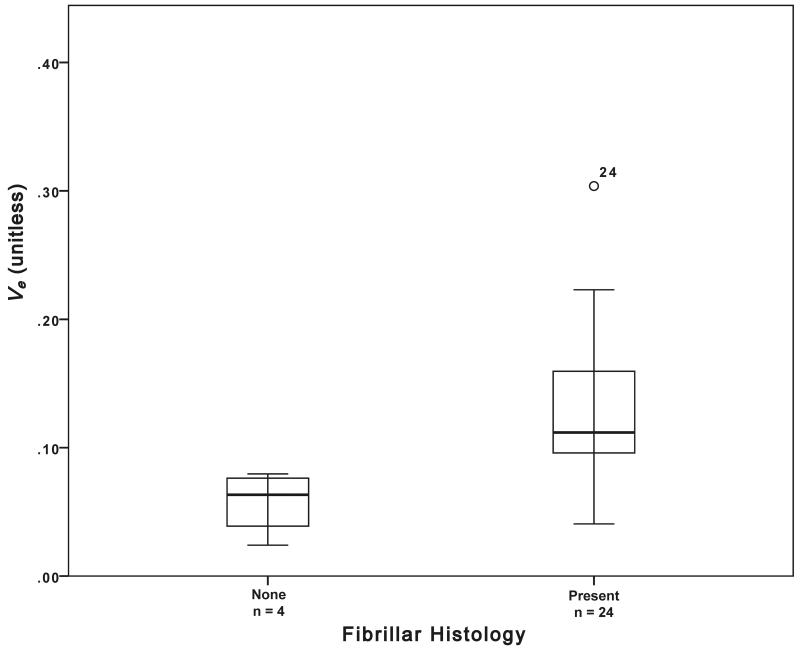
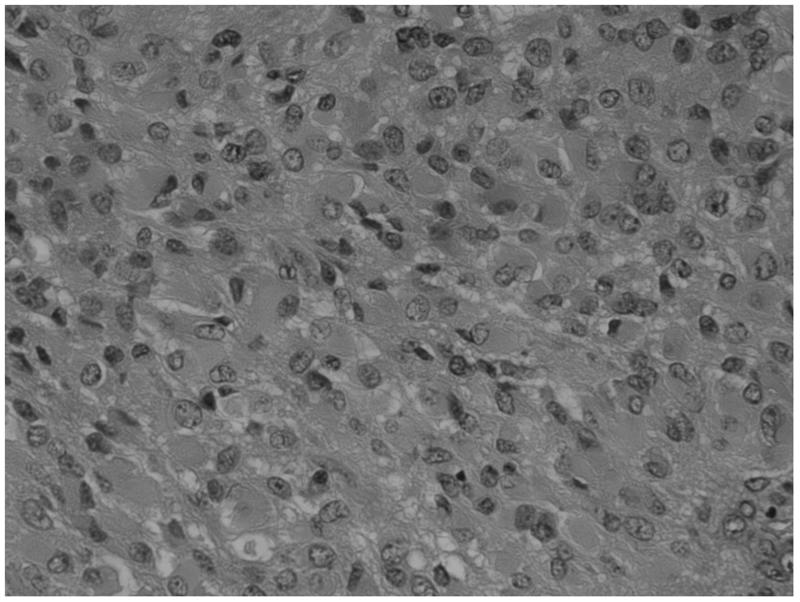
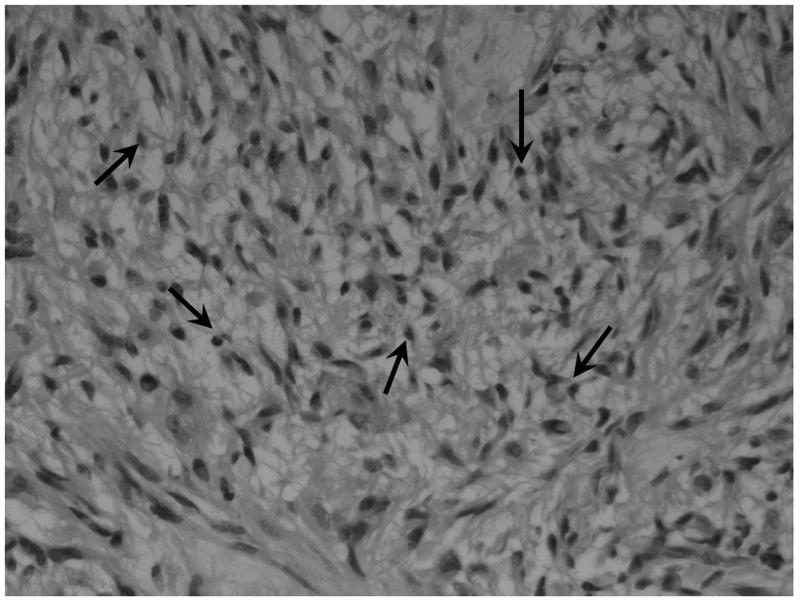
Figure 1.
a) Boxplot of fibrillar histology and ve (estimated p = 0.007). b) Example histological specimens showing tumours without and c) with the presence of fibrils (small fibres measuring approximately 1 mm, black arrows). H&E stain × 40 magnification. d) Boxplot of frank necrosis and Ktrans (estimated p = 0.005).


