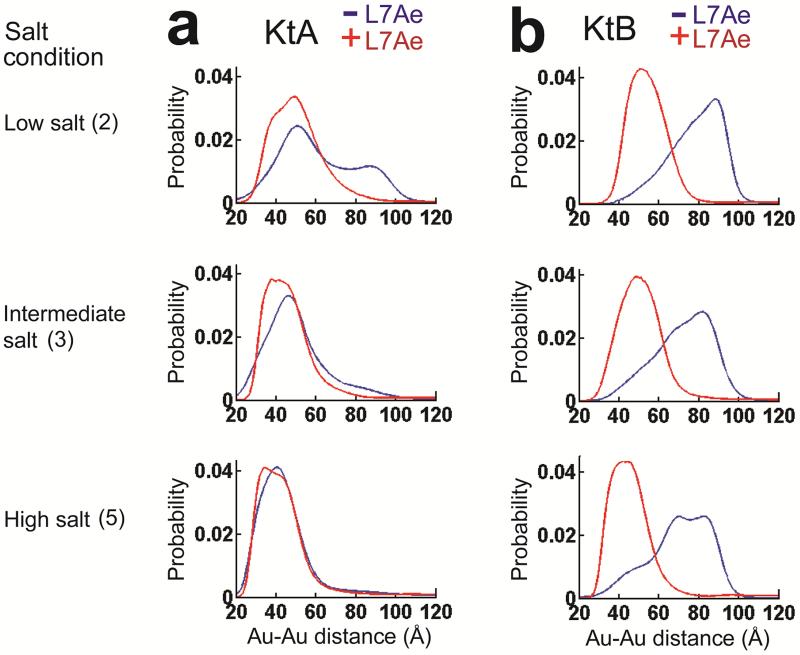
Figure 4. The KtA and KtB kink-turn conformational states without and with L7Ae.
The measured Au-Au center-to-center distance distribution for KtA (a) and KtB (b) without (blue) and with (red) bound L7Ae in 70 mM TrisHCl, pH 7.4, 10 mM sodium ascorbate and either 50 mM NaCl (low salt; Condition 2), 150 mM KCl and 1 mM MgCl2 (intermediate salt; Condition 3), or 50 mM NaCl and 10 mM MgCl2 (high salt; Condition 5). See the legend of Figure 2a and text for a description of the salt conditions, and see Online Methods for experimental details. The data for KtA without bound protein are reproduced from Figure 2a for comparison.

