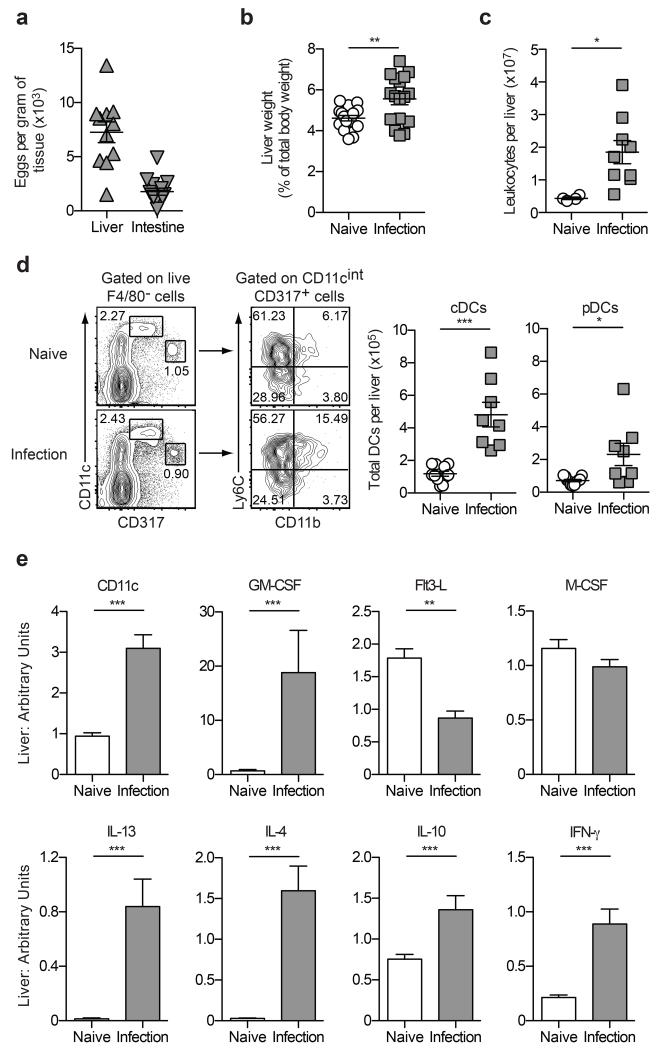
Figure 1. The liver is a major effector site during S. mansoni infection.
(a) The total number of S. mansoni eggs per gram of liver or intestine tissue isolated from mice infected with S. mansoni for six weeks. (b) Liver weights of naïve and infected mice represented as a proportion of total body weight. (c) The total number of leukocytes isolated from the livers of naïve and infected mice. (d) Gating strategy to identify DC populations and quantification of the total number of cDCs and pDCs in the livers of naïve and infected mice. The cDC population was defined as F4/80−CD11chighCD317− cells, while the pDC population was defined as F4/80−CD11cintCD317+Ly6C+CD11b− cells. (e) Quantitative RT-PCR was used to measure mRNA transcripts in whole liver tissue from naïve and infected mice. Data are expressed relative to the housekeeping gene Ubiquitin. Data are pooled from two experiments. Error bars indicate mean ± SEM.

