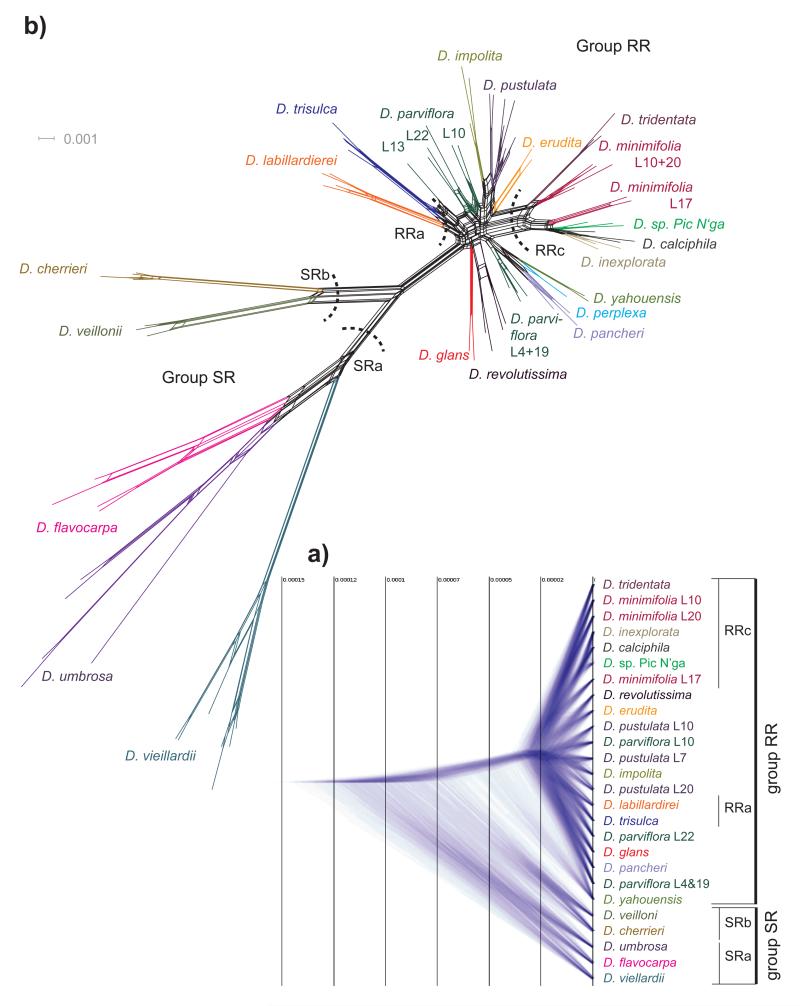
Figure 3.
a) Species trees generated by SNAPP analysis. The distances on the horizontal axis are relative measures of substitutions per site. The nodes are positioned as a star tree to highlight the timing of species radiation. Time on the grid is scaled to the number of mutations. b) NeighbourNet based on Hamming distance. Each species is shown with a different colour. L. refers to sampling locations given in Fig. 1 and Table 1.

