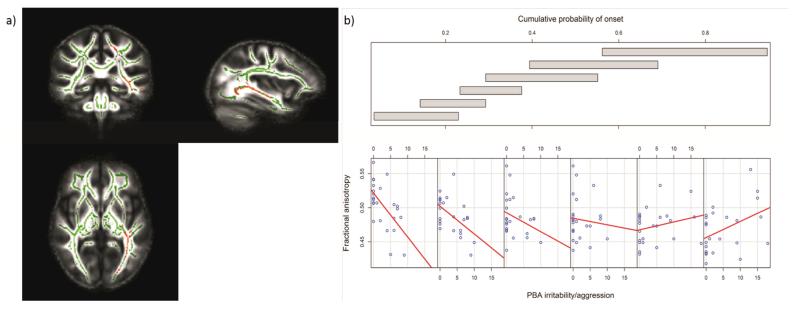
Figure 2.
Tracts in which reduced FA was correlated with increased levels of irritability/aggression in those with low CPO; FWE-corrected threshold of P<0.05. a) Results (red-yellow) are projected on a white matter skeleton (green), overlaid on a customized mean FA image. FA as a function of PBA irritability/aggression (lower scatterplot), conditional on CPO (upper panel). The upper panel depicts the overlapping ranges of CPO that determine the subsample of each scatterplot. A linear regression line was fit for each scatterplot to aid interpretation.

