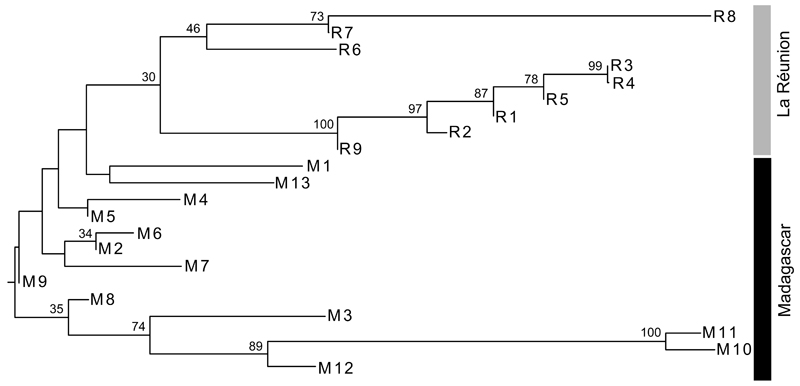
Figure 4.
Mid-point rooted neighbor-joining (NJ) phenogram depicting genetic (FST) distances between 22 B. occultum populations from Madagascar (M1–13) and La Réunion (R1–9). Numbers above branches indicate bootstrap values (≥ 30%) based on 1000 replicates. See Table 1 for explanation of population codes.

