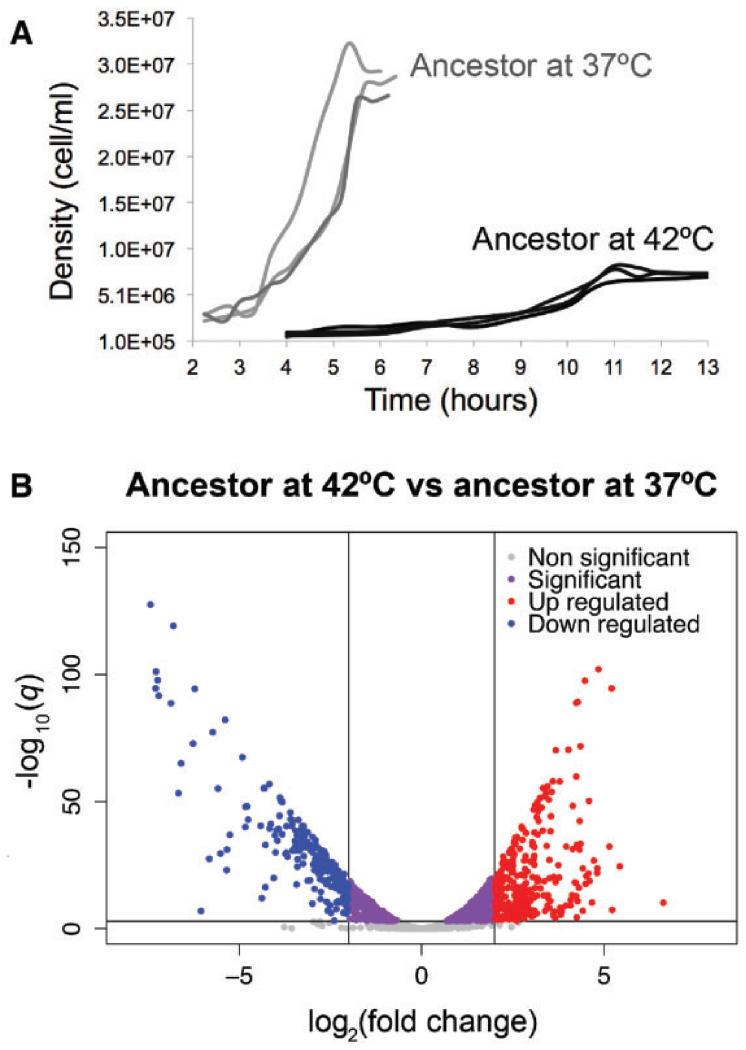
Fig. 2.
Phenotypic characterization of the ancestor at 37 °C and 42 °C. (A) Growth curves of the ancestor grown at 37 °C and 42 °C (three replicates at each temperature). (B) Volcano plot showing the global differential expression of genes (represented as dots) between the ancestor grown at 42 °C compared with the ancestor grown at 37 °C. Colors represent status with respect to 2-fold expression difference, represented by two vertical lines, and a significance at q = 0.001, represented by an horizontal line.

