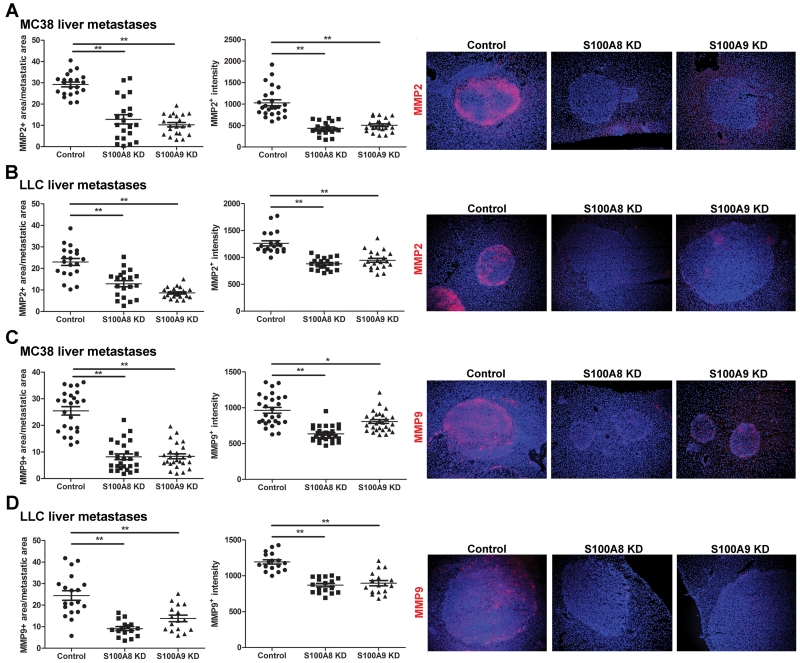
Figure 7.
Effects of S100A8 and S100A9 knockdown on MMP2 and MMP9 expression in liver metastases. Tissue sections from tumor bearing livers of mice inoculated with control, S100A8 KD or S100A9 KD (A) MC38 and (B) LLC cells were stained for MMP2 and the density and intensity of staining quantified. Tissue sections of (C) MC38 and (D) LLC liver metastases were also stained for MMP9 and the density and intensity of staining quantified. Representative images taken at 10× magnification are shown on the right, n=5-6/group with 2-3 tumor colonies imaged per mouse, *p<0.05, **p<0.01.

