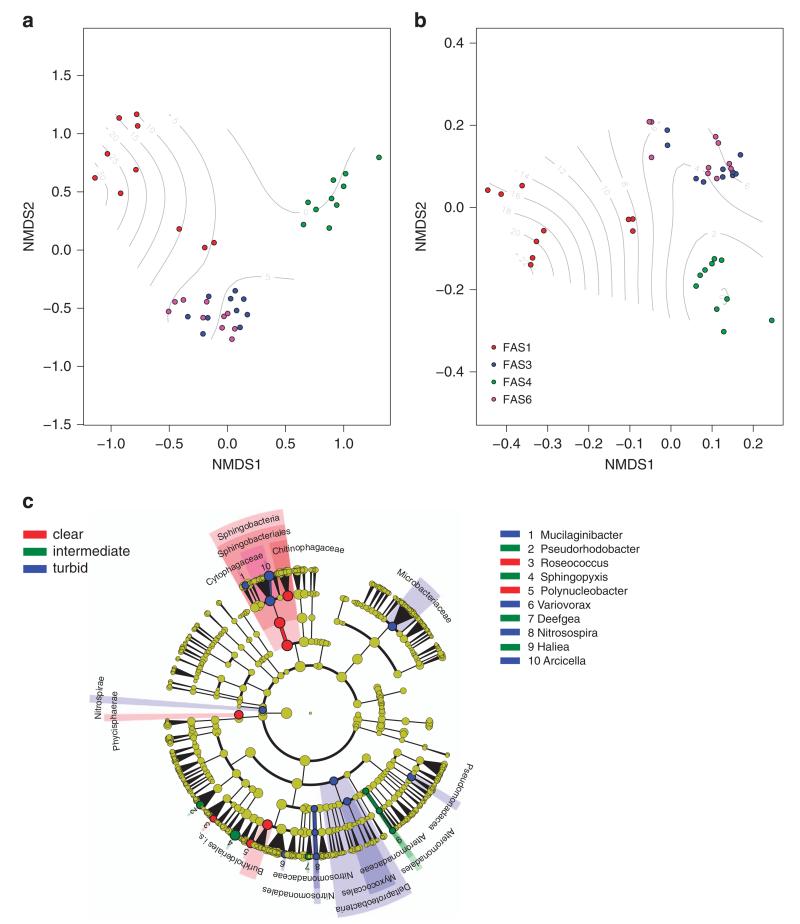
Figure 1.
Bacterial community compositional similarity. Shown are non-metric multidimensional scaling plots based on Bray–Curtis dissimilarity (a) and the weighted generalized Unifrac distance reflecting phylogenetic relatedness (b). The filled circles reflect bacterial community composition in the different lakes, with colors referring to the turbid lakes FAS 1, FAS 3 and FAS 6 and the clear lake FAS 4 according to the legend. Contour lines show a smooth general additive model surface reflecting the turbidity gradient among the samples. The cladogram (c) visualizes the output of the LEfSe algorithm, which identifies taxonomically consistent differences between clear (0–0.3 NTU), intermediate (1.3–6.3 NTU) and turbid (9.9–42.8 NTU) community members. Taxa with nonsignificant differences are represented as yellow circles and the diameter of the circles are proportional to relative abundance.

