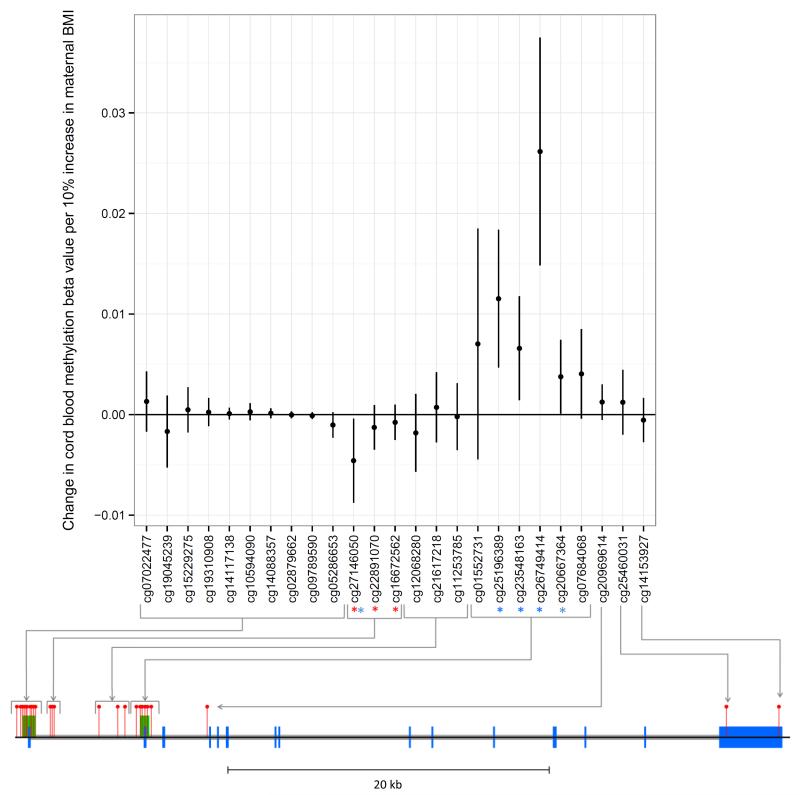
Figure 3.
Associations between maternal BMI and offspring methylation at birth at HIF3A CpG sites
Associations of maternal BMI and offspring cord blood methylation at birth at all 25 CpG sites at the HIF3A locus (mean change in methylation per unit increase in log maternal pre-pregnancy BMI; error bars indicate 95% confidence intervals). The locations of CpG sites on the HIF3A gene are mapped on the diagram below the graph. Blue blocks are exons, grey blocks are introns, green blocks are CpG islands and red pins are CpG sites. The three sites previously identified in adult peripheral blood as associated with own BMI are highlighted with a red asterisk. All sites associated with maternal BMI with a P-value <0.05 in our analyses are highlighted with a blue asterisk.

