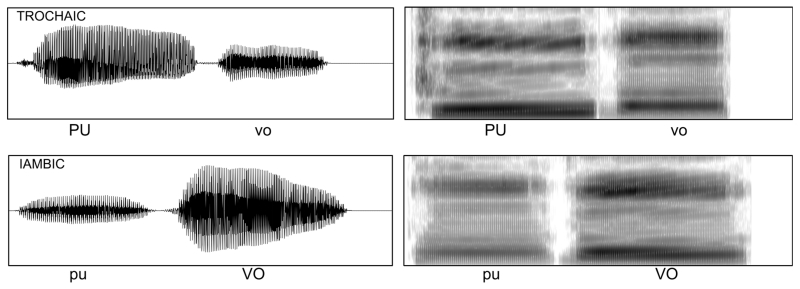
Fig. 1.
Oscillograms and spectrograms of the trochaic and iambic versions of one of the stimuli (puvo). Both the oscillograms and spectrograms were generated in Praat (see http://www.fon.hum.uva.nl/praat/) and are shown in a 1-s time window (x axis). The oscillograms display between −0.4 and +0.4 volts and the spectrograms display frequencies from 0 to 5000 Hz (y axis)

