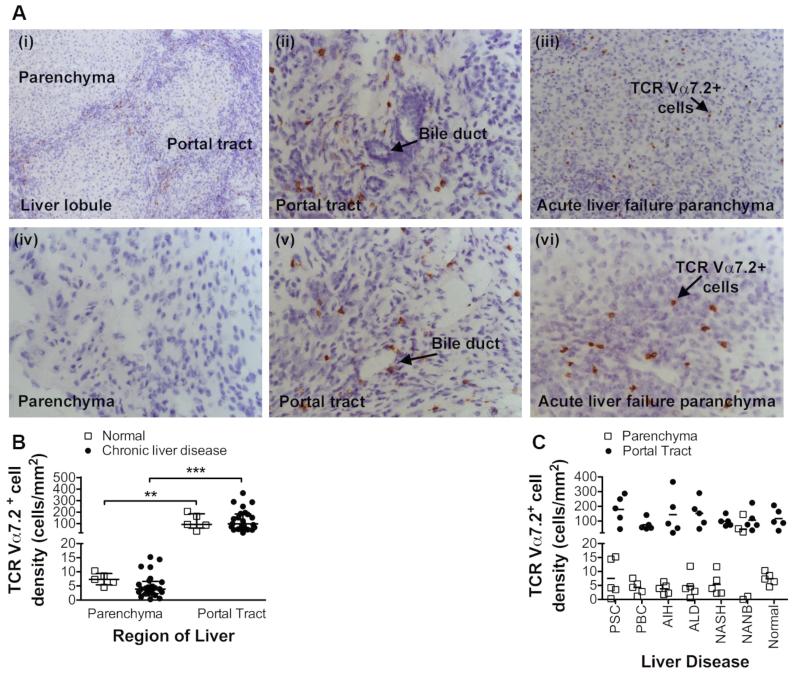
Figure 1. Peri-biliary localisation of Vα7.2+ cells in chronic liver diseases.
(A) Representative staining for Vα7.2 on frozen liver sections viewed at x10 (i and iii) or x40 (ii, iv, v and vi) magnification. Distribution of Vα7.2+ cells in the parenchyma (i and iv) and portal tract (i, ii and v) in PSC and in the parenchyma (iii and vi) in seronegative acute liver failure. (B) Densities of Vα7.2+ cells in parenchyma and portal tracts of normal and chronically diseased livers (**=p<0.01; ***=p<0.0001 by Mann-Whitney test). (C) Vα7.2+ cell density data according to diseases. Data are median ± interquartile range.

