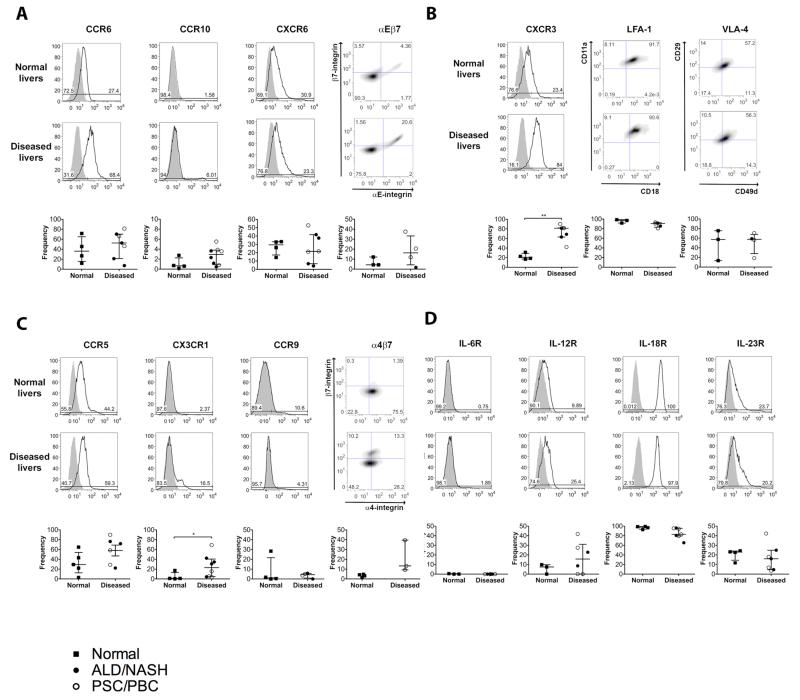
Figure 4. Expressions of tissue-homing chemokine, integrin and cytokine receptors on intrahepatic MAIT cells in normal and chronic liver diseases.
Chemokine receptor and integrin expression profiles (A, B and C) and cytokine receptor profiles (D) were determined by flow cytometry gating on the total CD3+ MAIT cell population. Representative overlays for marker (line) and isotype control (grey shadin g) and total summary data are shown. Summary data are median ± interquartile range. *=p<0.05; **=p<0.01; ***=p<0.001 by Mann Whitney test.

