Figure 1.
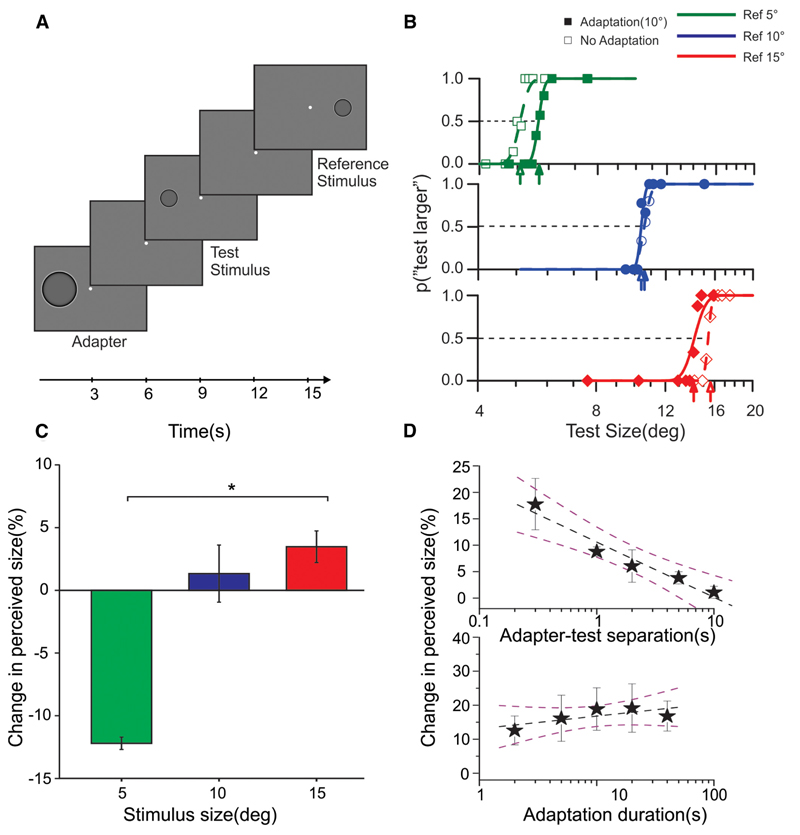
Behavioral experiments. A, Subjects discriminated the size of two sequentially presented stimuli (test and reference) displaced horizontally to opposite positions (eccentricity ±9°) relative to screen center. The reference stimulus was 5°, 10°, or 15°, and the size of the test stimulus varied around that of the reference. The stimuli were bandpass images of filled circles, which induced the Craik–O’Brien–Cornsweet illusion (apparent spreading of brightness over the region). In adaptation blocks, the adapter stimulus (10°) was presented before the test centered at the same spatial location. Adapter, test, and the reference stimuli (all at 100% contrast) and the blanks between them were presented for 3 s. B, Psychometric discrimination functions for 5°, 10°, and 15° of a typical subject: when the size of the reference stimulus was 5° (top, green), adaptation to a 10° stimulus resulted in a rightward shift of the psychometric curve, indicating that adaptation decreases the perceived size. When the reference was 10° (middle, blue), no shift in psychometric curve was observed. With larger stimuli (15°, bottom), adaptation led to a leftward shift, indicating an increase in the perceived size. C, Percentage change in perceived size across all subjects: negative values indicate that stimuli appear smaller after adaptation, and positive values indicate that they appear larger. Stimuli of 5° and 15° exhibited a significant change in perceived size with adaptation (*p < 0.05, paired t test). D, Decay of the adaptation effect over time (test size, 5°; adapter size, 10°). Adaptation strength decreases monotonically with increased temporal separation between adapter and test (top; regression slope = −10.44 ± 1.4% per log-second). Changes in adaptation duration, over a range of 2– 40 s, do not significantly affect size illusion (bottom, slope of regression = 3.73 ± 2.1% per log-second). The stars depict the average percentage of size change across subjects, the dashed black line is the best linear fit to the data, and the dashed purple lines are the 95% confidence interval of the fit. Error bars are standard error of the mean (SEM).

