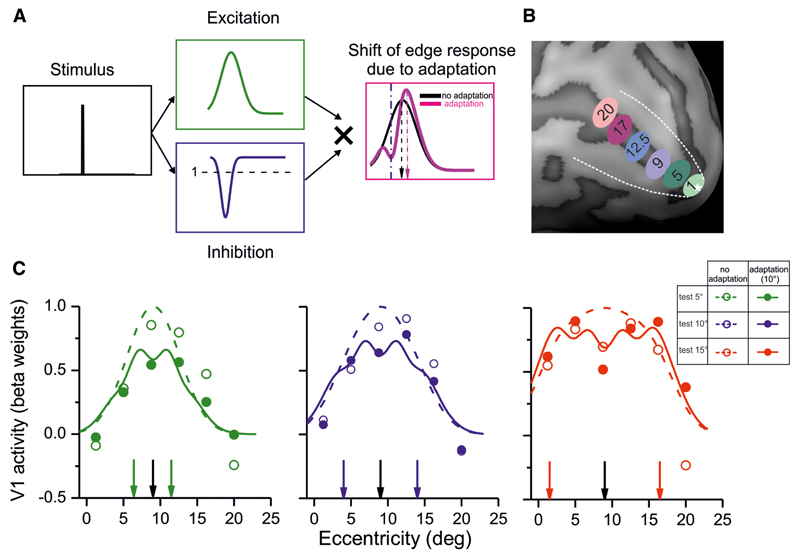
Figure 3.
Adaptation effect and its simulation by gain normalization as a function of eccentricity. A, A computational model of the size adaptation effect: after the presentation of the adapter stimulus, cortical areas representing the edges of the adapter undergo suppression, which can be simulated by a response gain modulation as function of cortical space (blue curve). During presentation of the subsequent test stimulus, activation that would normally be elicited by the stimulus (green curve) will be modulated by the gain modulation set by the previous adapter. The multiplication of the two curves will result in a shift in the representation of the stimulus edges away from the adapter. Such a model would predict that, for large stimuli, the edges are shifted outward, whereas for small stimuli, they will shift inward. B, To test the model depicted in A, responses of six different ROIs at different eccentricities were sampled (1.25° to 20°) C, The responses to the stimuli with and without adaptation are shown at each eccentricity with open and filled circles. The vertical black arrow represents stimulus center (9° eccentricity) and colored arrows the location of stimulus edges at each size. The continuous and dashed curve report the predicted activations based on the modelshown in A (for computational details, see Materials and Methods). The curves closely match the measured responses (mean R2 = 81%).

