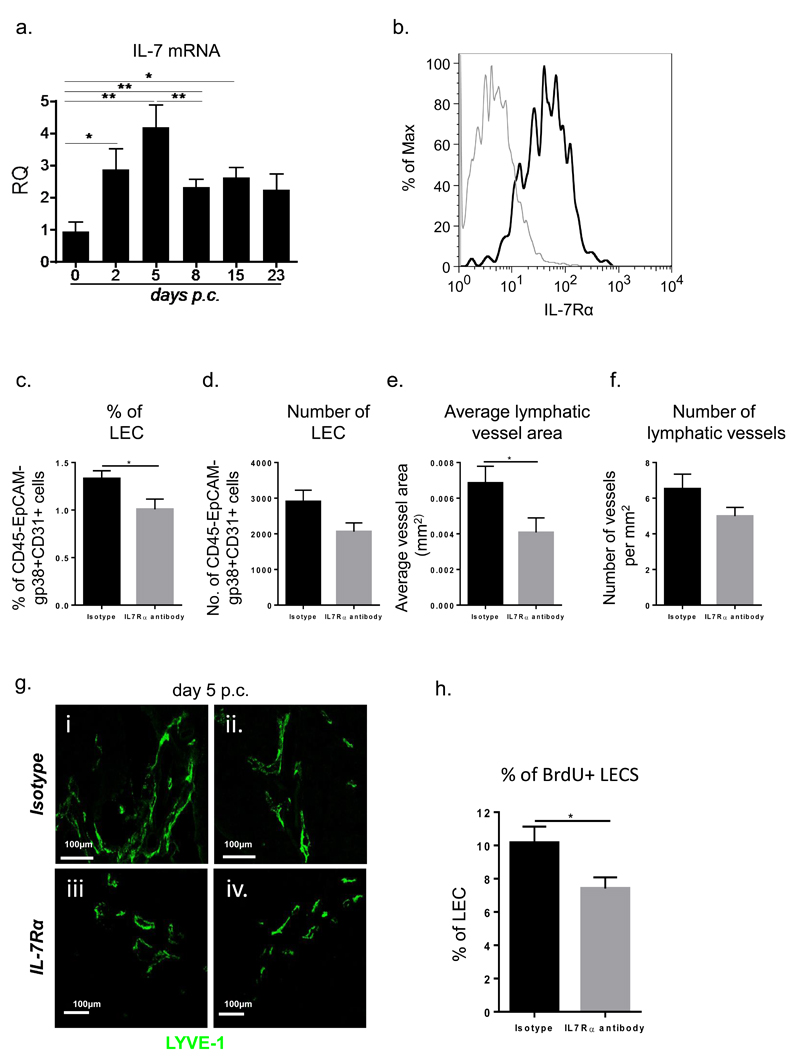
Figure 4. The early phase of lymphatic vessels remodelling is dependent on IL-7.
a, Quantitative RT-PCR analysis of mRNA transcript for il-7 in wt mice (white bars) in comparison to their wt counterparts (grey bars) at day 0, day 2, day 5, 8, 15 and 23 p.c. Transcripts were normalized to housekeeping gene pdgfrβ. The relative expression values (RQ) were calibrated with day 0 p.c. salivary gland values; *, p < 0.05, **, p < 0.01. Data are representative mean+s.e.m of three to four experiments with six to four glands analysed per group. b, Histogram showing IL-7Rα expression (black) and isotype control (grey) on LECs in salivary glands at day 5 p.c. c, Graph showing flow cytometry analysis of percentage of LEC in wt mice treated with isotype antibody (black bars) as compared to IL-7Ra blocking antibody treated mice (grey bars) mice. Data represented as mean+s.e.m *, p < 0.05. d, Graph showing flow cytometry analysis of absolute number of LEC in wt mice treated with isotype antibody (black bars) as compared to IL-7Ra blocking antibody treated mice (grey bars) mice. Data represented as mean+s.e.m. e-f, Graphs summarizing image analysis results showing differences observed in the number of lymphatic vessels per mm2 of tissue area and average vessel area (mm2) in wt mice treated with IL7Rα blocking antibody (grey bars) compared to isotype treated mice (black bars). Data are representative of two independent experiments with four to six glands analysed per group. Data shown as mean+s.e.m *, p < 0.05; unpaired t test. g, Representative microphotograph of lymphatic vessels in infected salivary glands (day 5 p.c.) from IL7Rα blocking antibody treated mice in comparison to wt mice treated with isotype stained for LYVE-1 (green). Scale bar 100um. h, Graphs showing summary of analysis for percentage of proliferating (BrdU+) gp38+CD31+ LEC within the CD45-EPCAM- stromal fraction in wt mice treated with isotype antibody (black bars) as compared to IL-7Rα blocking antibody treated mice (grey bars) mice. Data represented as mean+s.e.m *, p < 0.05.

