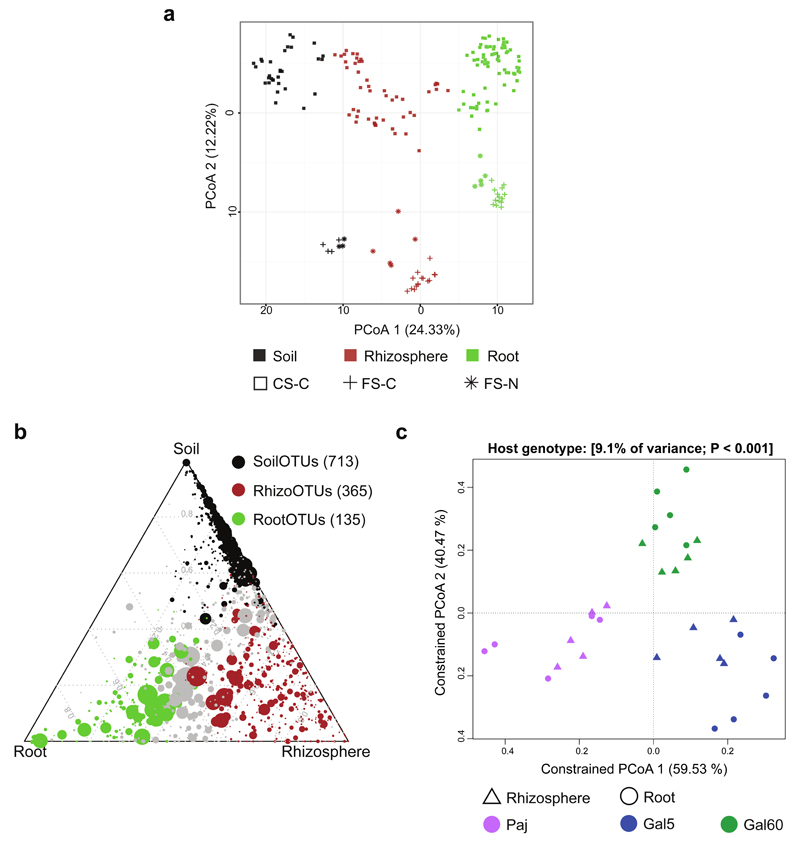
Figure 2. Bacterial community shifts in A. alpina rhizosphere and root compartments.
(a) Unconstrained ordination revealing that most of the variation among all 201 samples from the three experimental setups is explained by the factor compartment (first principal coordinate axis) and soil type (second principal coordinate axis) based on the Bray-Curtis distance metric. (b) Ternary plot depicting the number of OTUs enriched in the soil, rhizosphere and root compartments of the 59 samples of the ‘soil type and environment’ experiment (SoilOTUs (black), RhizoOTUs (brown), RootOTUs (green), respectively). Each circle depicts one individual OTU. The size of the circle reflects the relative abundance (RA). The position of each circle is determined by the contribution of the indicated compartments to the RA. Number in brackets: Enriched OTUs based on a Bayes moderated t-test; P < 0.05 (FDR-corrected). (c) Constrained principal coordinates analysis on the genotypes Paj, Gal60 and Gal5 grown in the French Soil in the greenhouse using the Bray-Curtis dissimilarity and constraining by host genotype. In each case the percentage of variation explained by each axis refers to the fraction of the total variance of the data explained by the constrained factor. CS-C: Cologne soil grown under controlled environmental conditions, FS-C: French soil grown under controlled environmental conditions, FS-N: French soil grown under native environmental conditions.

