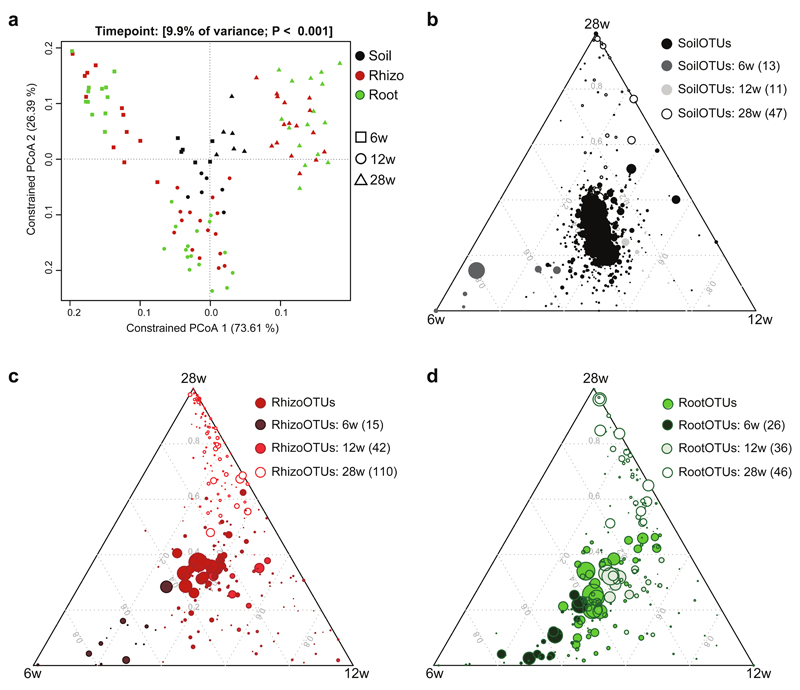
Figure 3. A. alpina root-associated bacterial communities depend on soil residence time.
(a) Principal coordinate analysis on samples from the ‘time course’ experiment (106 samples) constrained for the factor time point for soil, rhizosphere and root compartments at 6, 12 and 28 weeks (w). The percentage of variation explained by each axis refers to the fraction of the total variance of the data explained by the constrained factor. (b-d) Soil-, rhizosphere- and root-enriched OTUs (RootOTUs, RhizoOTUs, SoilOTUs) including OTUs observed across all tested time points and OTUs specific for individual time points. Time point-specific SoilOTUs (b), RhizoOTUs (c) and RootOTUs (d). The mean of soil (b), rhizosphere (c) or root (d) samples at each time point is plotted. Number in brackets: Total number of OTUs enriched in the respective compartment or time point. Enriched OTUs are based on a Bayes moderated t-test; P < 0.05 (FDR-corrected).

