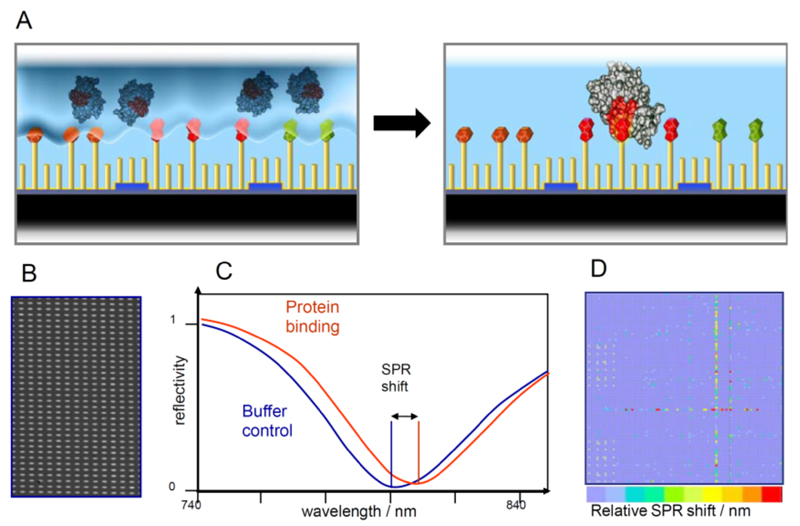
Fig. (1). The HT-CM-SPR scheme.
(A) The protein analyte is allowed to float over the array surface under controlled conditions to allow binding events to happen. SPR Imaging enables the detection of binding events: (B) Close-up of a grey scale picture obtained by CCD camera imaging of chemical microarray. (C) Grey scale analysis resulted in the parallel detection of 9,216 SPR minima per microarray exhibiting a shift in the resonance wavelength upon protein binding to the immobilized compounds. (D) Generic example of a color coded visualization of one array experiment.

