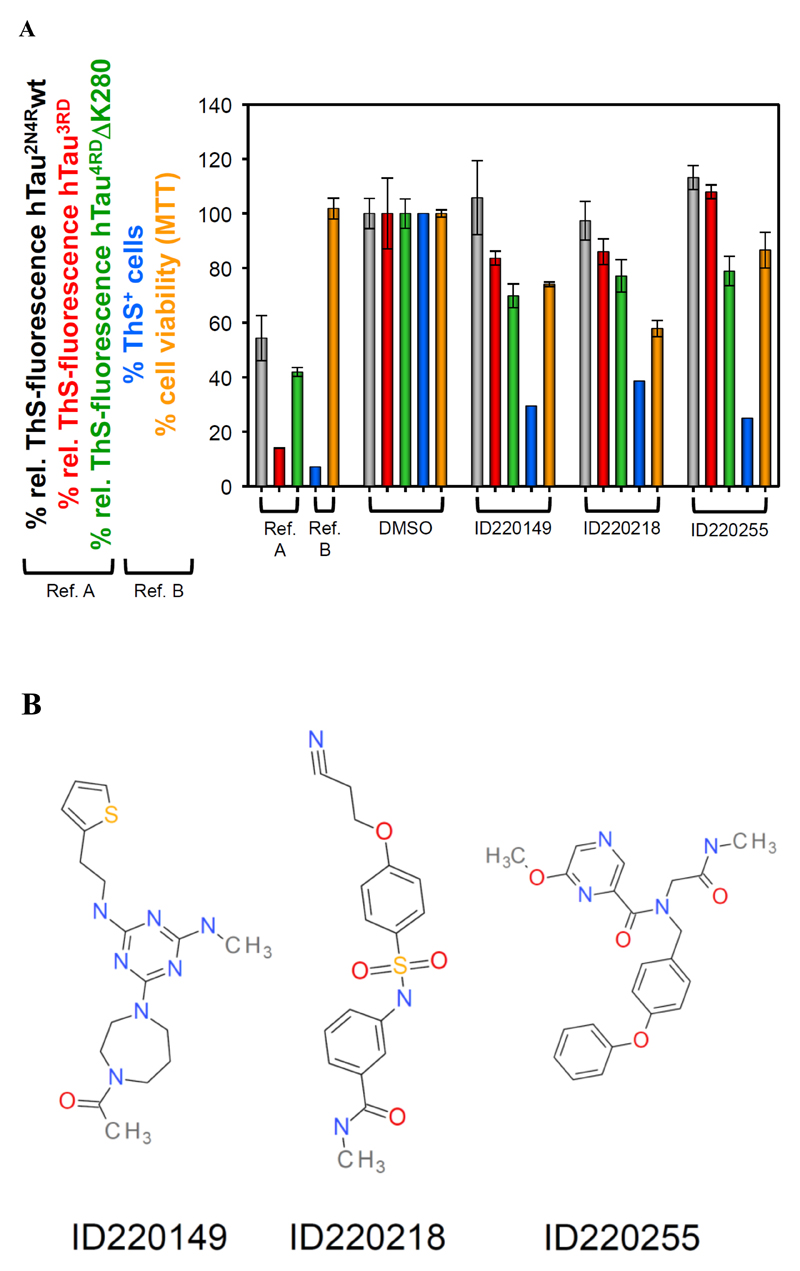
Fig. (3).
(A) Thioflavin S fluorescence as indicator for the extent of Tau aggregation after incubation with compounds. Bar colors: Grey hTau2N4Rwt; red Tau3RD; green Tau4RDDK280; blue ThS+ N2a cells (expressing Tau4RDDK280 with aggregates); orange viability of N2a cells (MTT assay). Reference results are shown for earlier studies with different classes of compounds: in vitro studies with bb14 [40],, cellular studies with BSc3094 [41]. The in vitro ThS-signal of the soluble Tau protein was subtracted from all samples. (B) Examples of chemical structures of Tau binding compounds identified by HT-CM-SPR screen.

