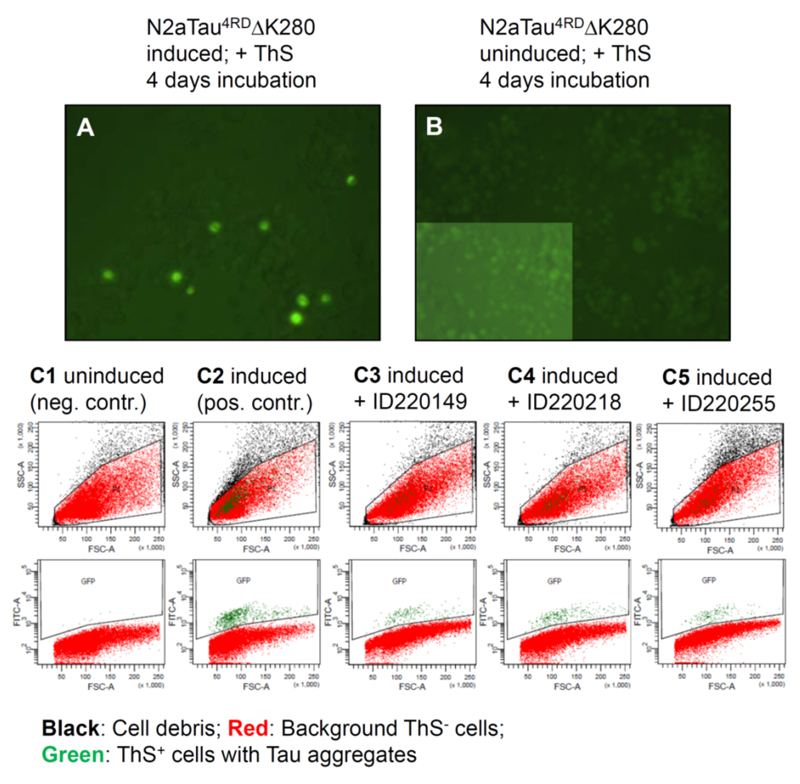
Fig. (5). N2a cells with Tau aggregates stained by Thioflavin S.
Fluorescence microscopy shows a representative section of the N2a cell population after 4 days of Tau expression. Cells bearing higher Tau aggregates appear bright green (A) whereas cells with soluble or oligomeric Tau show only background staining (A, green background), similar to cells without any Tau expression (B). (C1 – C5) shows examples of cell distributions by FACS counting after 4 days of incubation, without Tau expression (C1, negative control), with Tau expression (C2, positive control), and with Tau expression in the presence of Tau-aggregation inhibitors ID220149 (C3), ID220218 (C4) and ID220255 (C5). The cell signals were plotted with regard to cell morphology (upper panels: FSC (forward scatter indicating the particle size) vs. SSC (side scatter indicating the particle granularity), and with regard to the amount of cells with Tau aggregates (lower panels: FSC vs. fluorescence intensity measured in the FITC channel). Cell debris would appear as small particles (small FSC values) with high density (high SSC values). Note that the green ThS+ cells are well separated from the cell debris population shown in black. The reduction of aggregate-bearing cells by the inhibitor is apparent from the lower panels.

