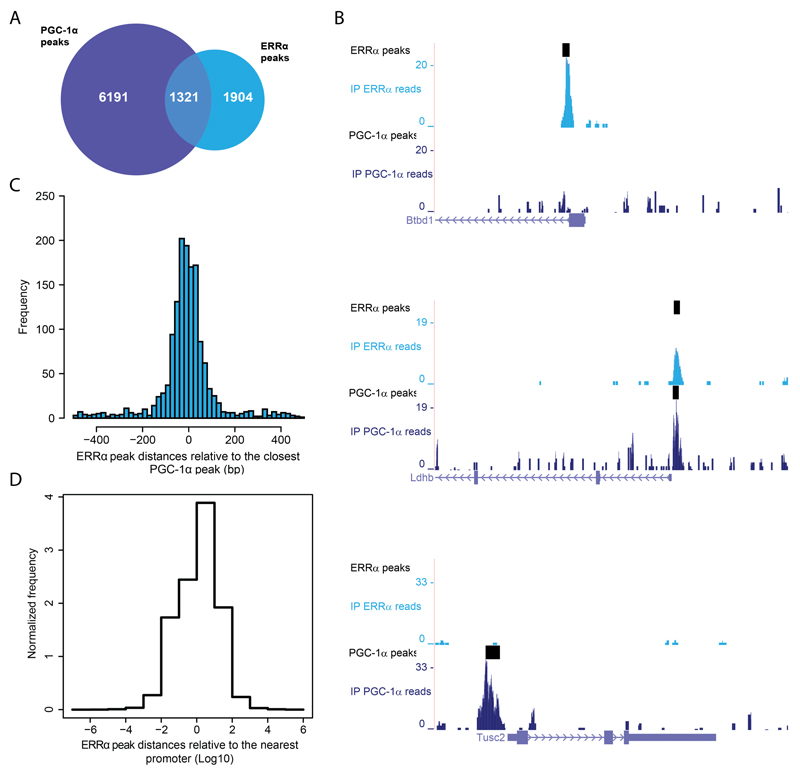
Figure 1. ERRα and PGC-1α are recruited to both shared and distinct sets of DNA elements and target genes.
(A) Venn diagram depicting the number of ChIP-Seq binding peaks for PGC-1α (blue) and for ERRα (cyan). (B) PGC-1α and ERRα read densities around the TSS of the genes Btbd1 (only ERRα peak), Ldhb (overlapping ERRα/PGC-1α peaks) and Tusc2 (only PGC-1α peak) obtained from the UCSC Genome Browser. (C) Distribution of ERRα peaks relative to their closest PGC-1α peaks. (D) Distribution of all ERRα peaks from the nearest mouse promoter region.

