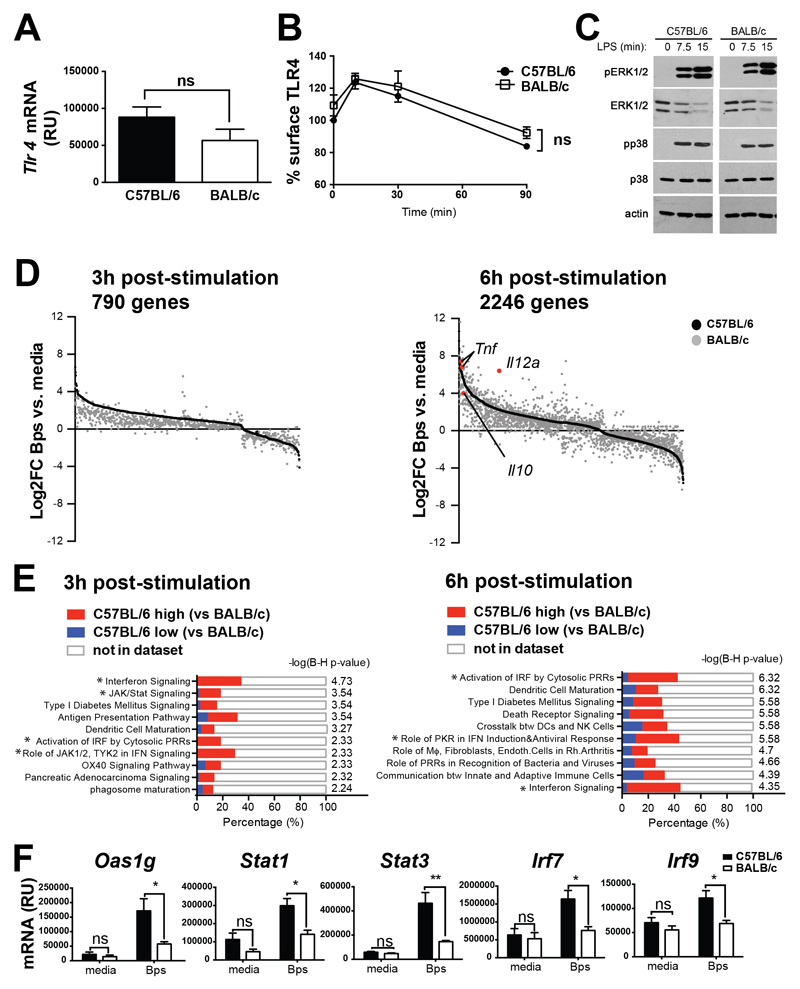
Figure 2. C57BL/6 macrophages show similar early TLR4-induced responses, but higher expression of type I IFN pathway genes, as compared to BALB/c macrophages.
(A) Tlr4 mRNA expression in C57BL/6 and BALB/c BMDMs at steady state was determined by qRT-PCR and normalised to Hprt mRNA expression. (B) C57BL/6 and BALB/c BMDMs were stimulated with LPS for the indicated times and TLR4 expression analysed by flow cytometry. (C) BMDMs were stimulated with LPS as indicated and phosphorylation of ERK1/2 and p38 in whole cell lysates was determined by Western blotting. (D-F) C57BL/6 and BALB/c BMDMs were stimulated with B. pseudomallei for 3 h or 6 h in triplicate cultures. Total RNA was isolated and processed for microarray analysis as described in Materials and Methods. (D) Genes significantly differentially regulated by B. pseudomallei in C57BL/6 and BALB/c BMDMs were identified by two-way ANOVA analysis (p<0.01, Benjamini-Hochberg False Discovery Rate) and the selection of genes that were significantly different due to both stimulation and strain. Genes significantly changed due to stimulus alone or strain alone, were excluded from the analysis. Expression level of individual genes (black dots = C57BL/6; grey dots = BALB/c) are shown as Log2 fold change over corresponding media control samples, and ordered according to their C57BL/6 expression level. (E) Top 10 IPA pathways significantly associated with the genes differentially regulated by B. pseudomallei stimulation in C57BL/6 and BALB/c macrophages at each time-point are shown. The x-axis represents the percentage overlap between input genes and annotated genes within the pathway. Colours within bars denote genes that are more highly expressed in C57BL/6 or BALB/c macrophages. Benjamini-Hochberg (B-H) corrected –log(p-value) represents pathway association. * denotes type I IFN related pathway. (F) C57BL/6 and BALB/c BMDMs were stimulated with B. pseudomallei for 6 h. Gene expression was determined by qRT-PCR and expression values normalised to Hprt1 mRNA expression. All graphs show means ±SEM of 3 independent experiments. *p<0.05, **p<0.01, ***p<0.001 as determined by two-way ANOVA (Bonferroni’s multiple comparison test). Western blot (C) is representative of 2 independent experiments.

