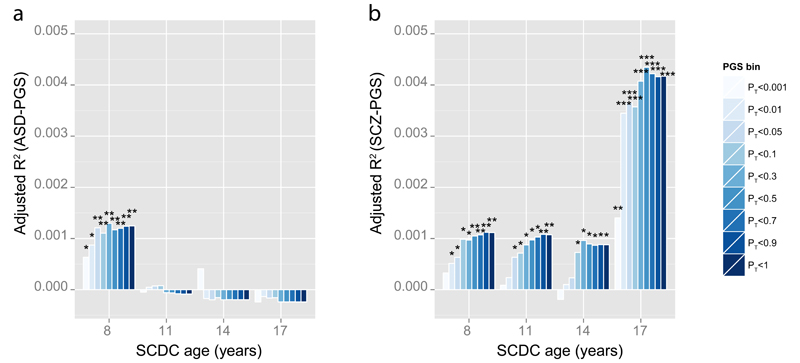
Figure 2. Proportion of variance in SCDC scores explained by polygenic scores for (a) clinical ASD and (b) clinical schizophrenia.
Polygenic scores (PGS) were constructed in ALSPAC based on the largest publicly available samples for ASD (PGC ASD) and schizophrenia (PGC-SCZ2) as a training set, and then Z-standardised. The proportion of explained phenotypic variance in rank-transformed SCDC scores (Adjusted-R2) is displayed cross-sectionally at 8, 11, 14 and 17 years and given with respect to ASD-PGS (a) and schizophrenia-PGS (b). Nine different P-value thresholds PT for selecting risk alleles (PGS bins) in clinical samples are displayed. Starred P-values indicate the strength of the association (*P ≤ 0.05, **P ≤ 0.01 and ***P ≤ 0.001).
ALSPAC - Avon Longitudinal study of Parents and Children; ASD - Autism Spectrum Disorders; PGC-ASD - ASD collection of the PGC; PGC - Psychiatric Genomics Consortium ; PGC-SCZ2 - Samples of the second PGC mega-analysis of SCZ; PGS bin - Z-standardised polygenic scores according to threshold PT; SCDC - Social-Communication Disorder Checklist; SCZ - Schizophrenia

