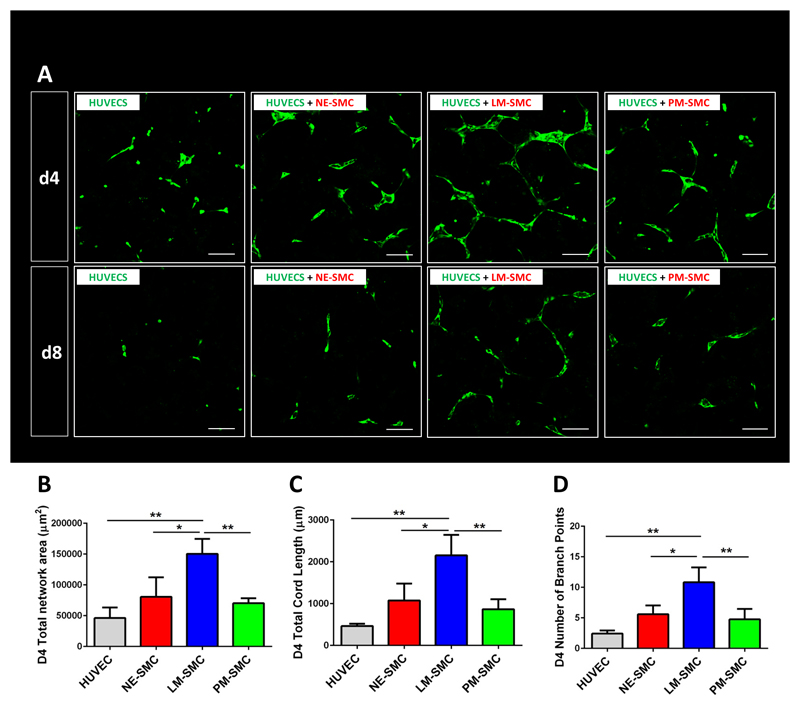
Fig. 3. Paracrine effects of lineage-specific SMCs on HUVEC networks.
HUVECs were exposed to supernatant conditioned by lineage specific SMCs (as depicted in fig. S4B). (A) Confocal images of paracrine co-cultures taken on day 4 and day 8 of the protocol. (B) Quantification of total network area in μm2. (C) Quantification of total cord length. (D) Quantification of number of branch points. Quantitative data is shown for day 4 of the co-culture (*p<0,05, **p<0,01, ***p<0,001, n=3 independent biological replicates, scale bars= 100 μm).

