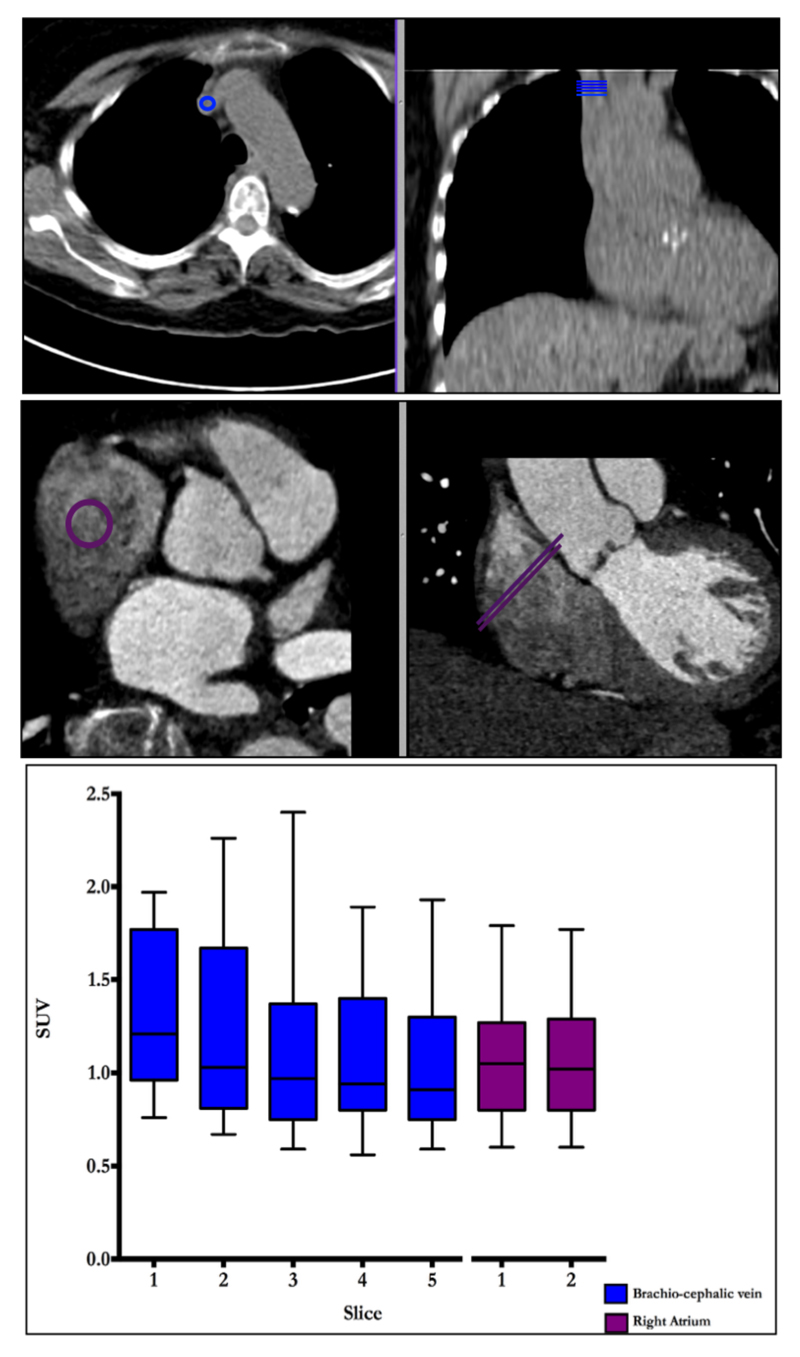
Figure 3. Measuring Blood Pool Activity in the Brachiocephalic vein and the Right Atrium.
Regions of interest for measuring blood pool activity in the brachiocephalic vein (top) and right atrium (bottom) are shown in the en-face of the valve (left) and coronal (right) planes. Note that the right atrium is a much larger structure allowing for larger regions of interest with less potential for partial volume artifact problems related to poor registration. Tukey plot demonstrates mean SUV values for 5 contiguous slices from brachiocephalic (blue) and 2 from the right atrium (purple). Note the variation in brachocephalic vein measurements between those taken most caudally versus those taken most cranially.

