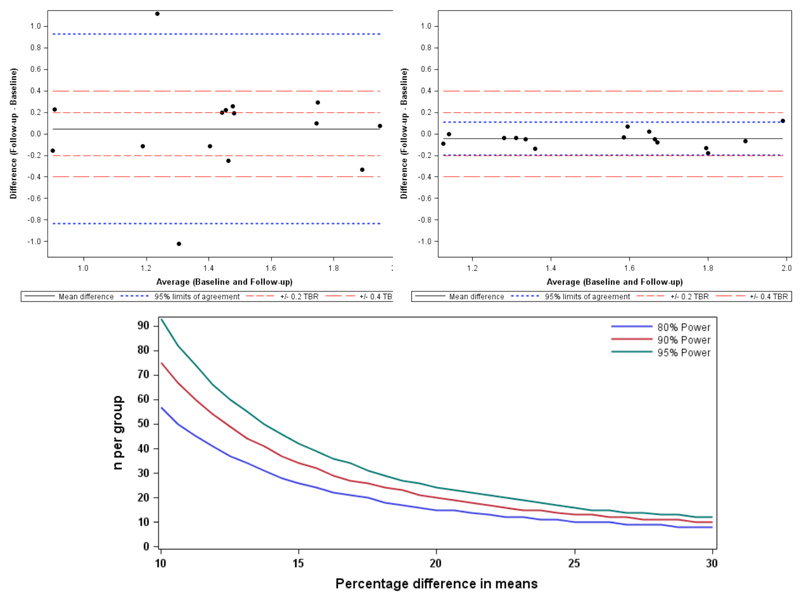
Figure 4. Scan-rescan Reproducibility for 18F-Fluoride PET quantification in the aortic valve with consequent sample size estimates.
Bland Altman plots of scan-rescan reproducibility for TBRMDSmean measurements using the original image analysis and acquisition methods (left) and then using final method (right). Percentage error for the final method is less than ±10%. Graph (below) shows the sample size estimates needed to detect differences in means which range from 10%to 30% of the initial scan point estimate. The plot illustrates the sample size required to detect differences in means ranging from 10% to 30% with figures shown for 80, 90 and 95% power. In all cases this assumes that the common standard deviation is 18.75%.

