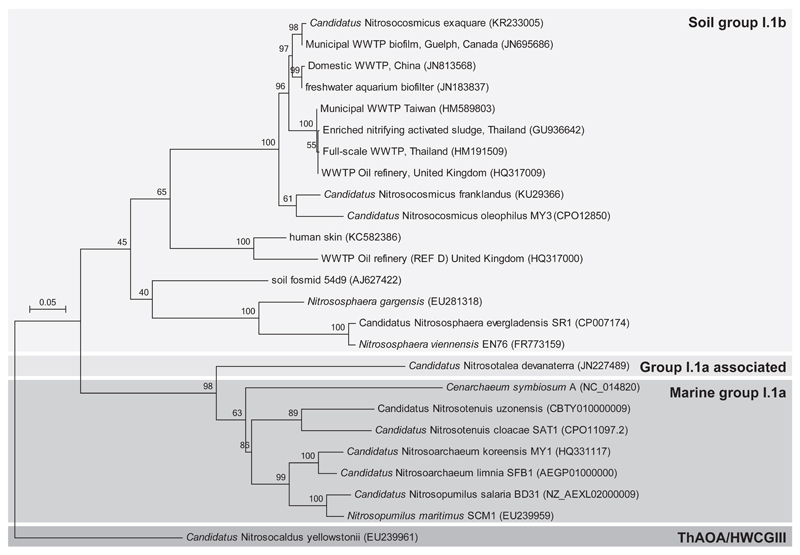
Figure 2.
Phylogenetic affiliations of amoA gene sequences for Candidatus Nitrosocosmicus exaquare and other thaumarchaeotal representatives inferred using the Maximum Likelihood method based on the General Time Reversible model. The tree is drawn to scale, with branch lengths measured as the number of substitutions per site. Bootstrap values are located above branches and are based on 500 replicates. Only bootstrap values greater than 50% are indicated on the tree. The scale bar represents 5% nucleotide divergence.

