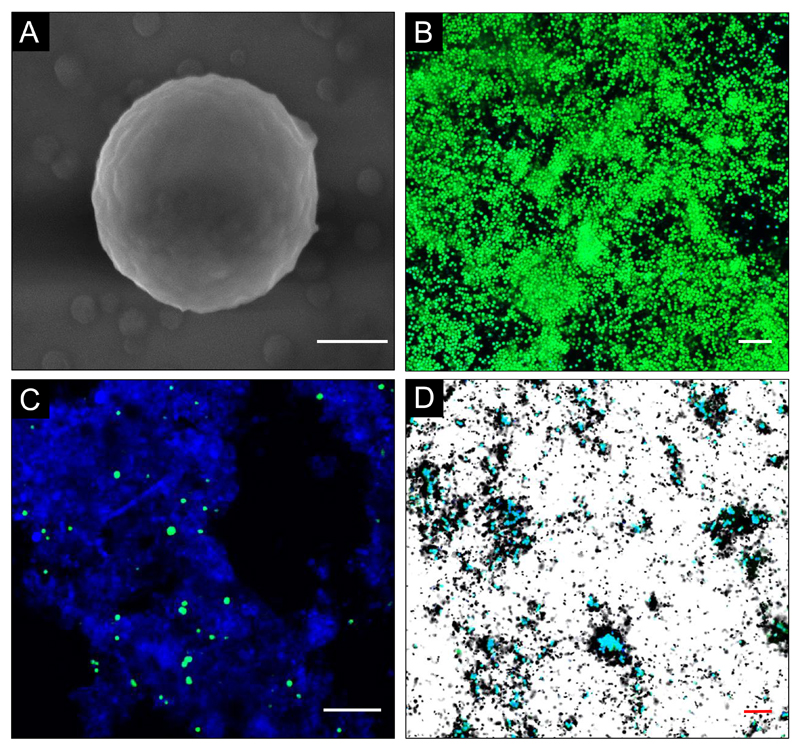
Figure 3.
Micrographs of Candidatus Nitrosocosmicus exaquare cells. A) Scanning electron micrograph with a 400-nm scale bar (measured cell diameter is 1.3 µm). B) CARD-FISH image of cells in enrichment culture. C) CARD-FISH image of thaumarchaeotal cells in RBC biofilm from the Guelph WWTP. D) CARD-FISH combined with MAR of Ca. N. exaquare enrichment culture cells labelled with 14C-bicarbonate. CARD-FISH images in panels B-D were obtained with probe thaum726 applied together with two competitor probes (compA, compB; see Table S4) and FITC-labelled tyramides (green). In these panels, DAPI was applied as a nucleic acid stain (blue) and scale bars are 10 µm.

