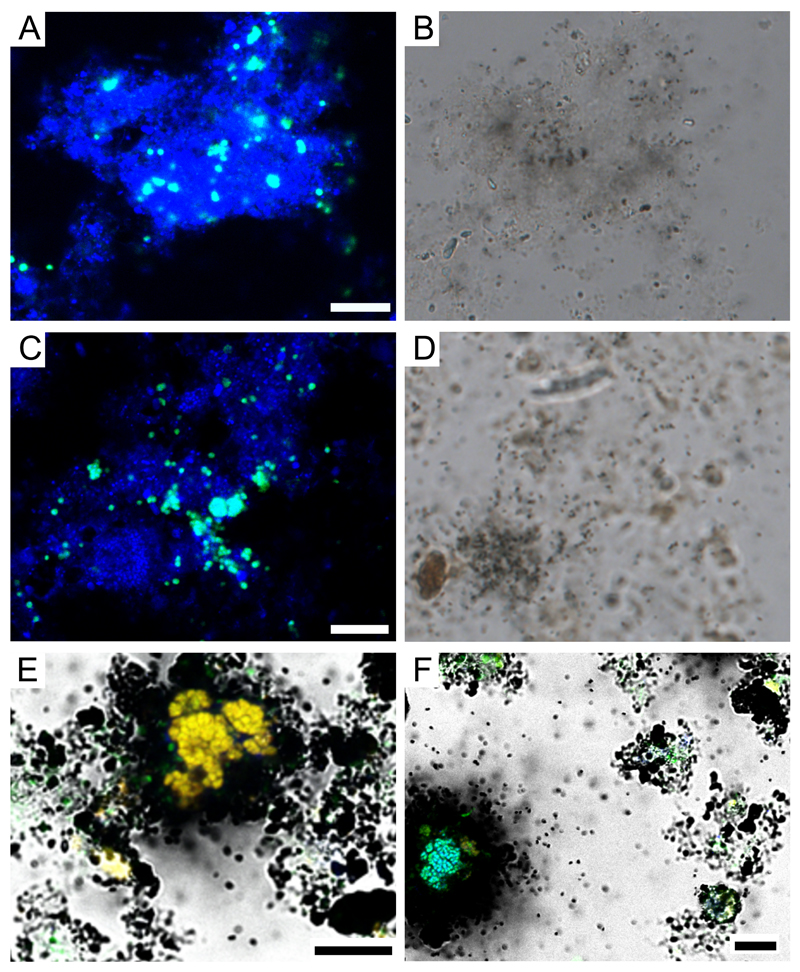
Figure 7.
CARD-FISH-MAR for thaumarchaeotes in RBC 1 (A, B) and RBC 8 (C, D) biofilm. FISH-MAR for AOB (orange/yellow) and Nitrospira (blue) (panels E and F; both RBC 8). Green signals in panels E and F originate from the EUB338 probe mix targeting most bacteria. Microautoradiographic images were taken with the CCD black/white camera integrated in the CLSM (panels E, F) or with an external CCD color camera (DFC 450, Leica Microsystem, Wetzlar, Germany; panels B and D). All scale bars represent 10 µm.

