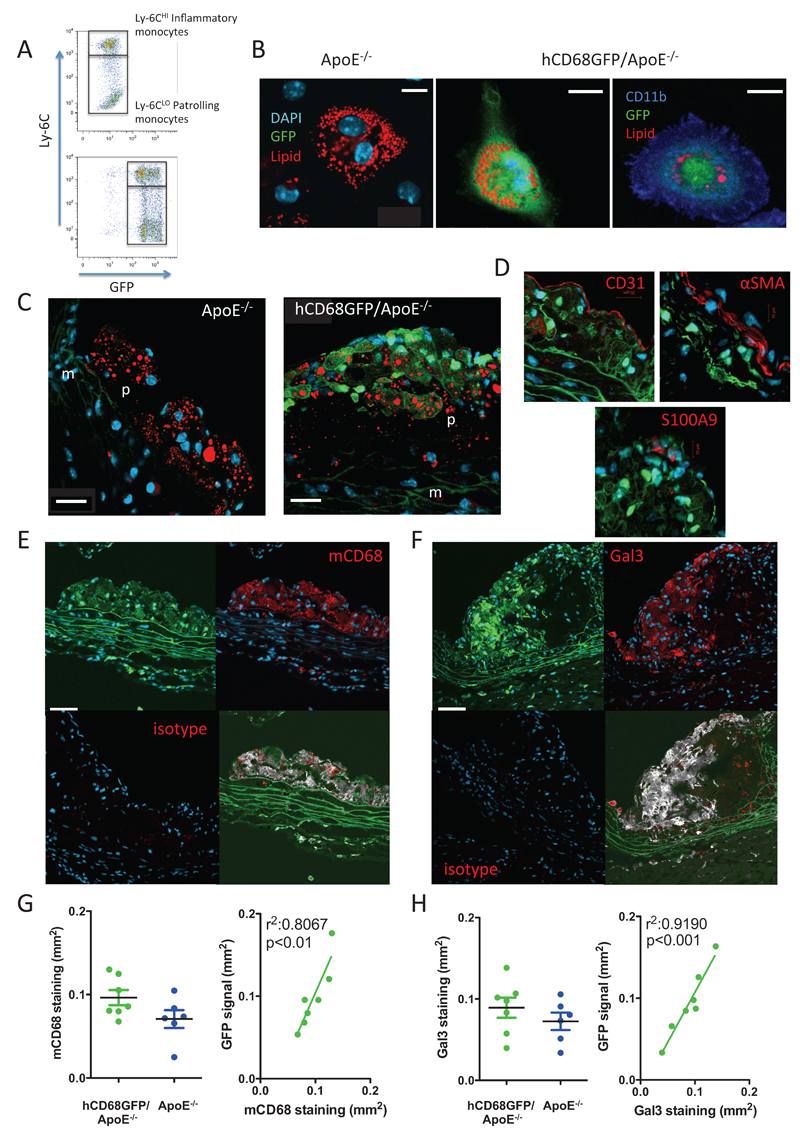
Figure 1. hCD68GFP/ApoE-/- mice show abundant GFP expression in arterial lesions.
A, Blood samples were harvested and stained to identify CD45+/CD115+/Ly6G- monocytes of both the Ly6CHI and LO phenotype. Compared to ApoE-/- mice the hCD68GFP/ApoE-/- mice have a clear increase in GFP fluorescence in both monocyte populations. B, 2% Thioglycollate solution was ip injected into mice that had been on a high fat diet for at least 8 weeks. 4 days following injection the elicited peritoneal cells were harvested and macrophages selected by adhesion to glass coverslips. Cells were fixed and stained with Lipidtox Red (red) to identify neutral lipid droplets and DAPI to visualize nuclei (blue), with cells being confirmed as macrophages by cell surface staining for CD11b expression (Right hand panel blue) (scale bar – 10μm). C, The aortic root from mice that had been maintained on a high fat diet for 10 weeks was fixed with 4% formaldehyde and cut into 7µm frozen sections. Staining for neutral lipids (red) revealed areas of strong GFP fluorescence (green) localized to lipid containing plaques only from mice harboring the hCD68GFP transgene, compared to ApoE-/- controls (p – plaque, m – media, DAPI - blue, scale bar – 20µm). D, Bright GFP fluorescence did not co-localise with markers of endothelial cells (CD31), infiltrating smooth muscle cells (alpha-smooth muscle actin) or neutrophils (S100A9). E and F, Strong co-localisation of GFP (green) at the cellular level was seen when sections were co-stained with anti-macrophage antibodies (targeted against mCD68 or Galectin 3) (red) and DAPI (blue) (scale bar – 20µm). A lack of staining in isotype control sections is shown in the lower left panel. Colocalisation is shown (grey) in the lower right panel, overlap with DAPI was removed to prevent any spillover, then pixels were assigned as green and/or red or neither using a threshold set on the non-GFP expressing/unstained controls. Pixels that were assigned both green and red were coloured grey in the resulting image. G and H, Quantification of the area of mCD68 and Gal3 staining within plaque from hCD68GFP/ApoE-/- and ApoE-/- mice showed no significant effect of GFP expression on macrophage infiltration into plaque and a highly significant correlation between GFP and mCD68/Gal3 staining. n=6-7, Students T-Test, p<0.05 regarded significant. . Linear regression analysis detected a highly significant relationship between GFP and mCD68/Gal3, p<0.05.

