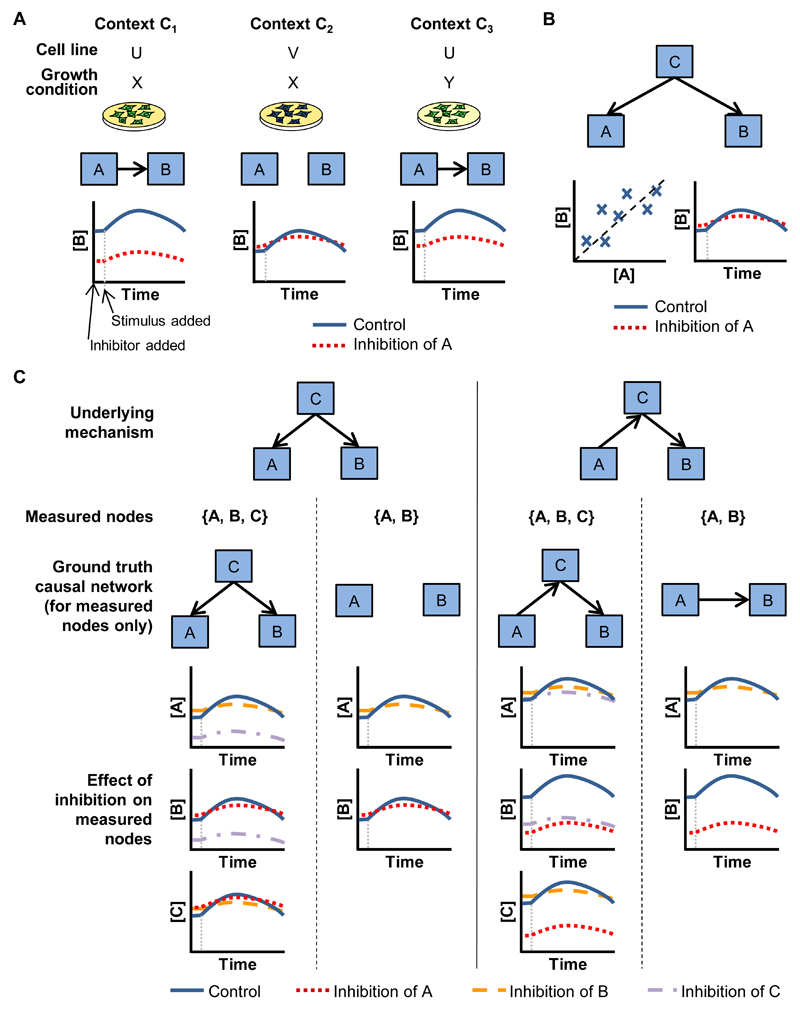
Figure 1. Context-specific Causal Networks.
(A) Context-specific causal influences. Node A has a causal influence on node B in contexts c1 and c3, but not c2, encoded by the presence of a causal edge between A and B in c1 and c3 only. This reflects the outcome of experiments where A is inhibited. Here, each context is defined by the combination of cell line and growth condition. (B) Correlation and causation. The abundance of node A is correlated with that of node B due to regulation by the same node C. However, as there is no causal influence (direct or indirect) of A on B, inhibition of A does not result in a change in the abundance of B, no matter how strong the correlation or statistical dependence. (C) Causal networks and missing nodes. In the first example, node C regulates both nodes A and B (as in panel (B)). In the formulation used here, if C is not observed and not included in the network, but A and B are, we would regard the network with no edge between A and B in either direction as the correct or ground truth causal network, in line with the results of experimental inhibition of these nodes, as shown. In the second example, the underlying mechanism is that A influences C, and C in turn influences B. In the formulation used here, if C is not measured and not included in the network, an edge from A to B would be regarded as correct, in line with the results of experimental inhibition of the nodes. However, if all three nodes were included, the correct network would match the underlying mechanism. Although abundance of B changes under inhibition of A, an edge from A to B would be regarded as incorrect here because the influence of A on B is fully mediated via another network node (i.e. C). See text for further details of the causal formulation and its interpretation.

