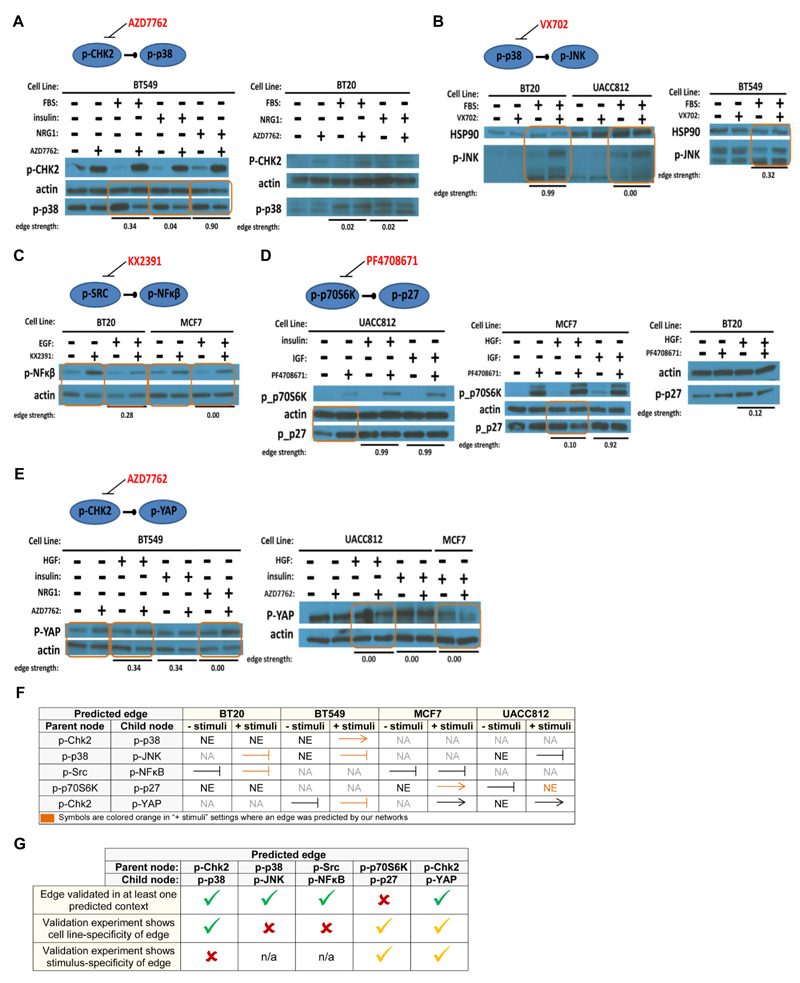
Figure 6. Validation of Network Edges.
Western blot analysis of selected context-specific network edges that were not in the prior network. Edges tested were: (A) phospho-Chk2 to phospho-p38 ; (B) phospho-p38 to phospho-JNK; (C) phospho-Src to phospho-NFκB; (D) phospho-p70S6K to phospho-p27; and (E) phospho-Chk2 to phospho-YAP. Orange boxed areas indicate observed changes in abundance of the predicted child node under inhibition of the parent node in a single (cell line, stimulus) context (changes in abundance are determined by visual inspection of the bands). Edge probabilities output by the network learning procedure are shown for each context tested (“edge strength”). (F) A summary of the validation experiments. ‘NA’ denotes “not applicable” – the experiment was not run. ‘NE’ denotes “no effect” – there was no change in child node abundance upon inhibition of the parent node. An arrow indicates results consistent with an activating parent node. A stunted line represents results consistent with an inhibitory edge. Symbols are colored orange to indicate that an edge was predicted for the corresponding cell line under one of the stimuli tested. (G) Summary of agreement and disagreement between predicted edges and validation experiments. First row indicates whether validation experiments showed evidence for the edge in a (cell line, stimulus) context in which it was predicted. Second and third rows concern the cell line- and stimulus-specificity of each edge respectively: a green tick denotes specificity in (partial) agreement with predictions from inferred networks; an orange tick denotes specificity, but not in agreement with predictions in terms of the precise contexts in which effects were seen; a red cross indicates that specificity was not observed in the validation experiments, despite being predicted by the networks.

