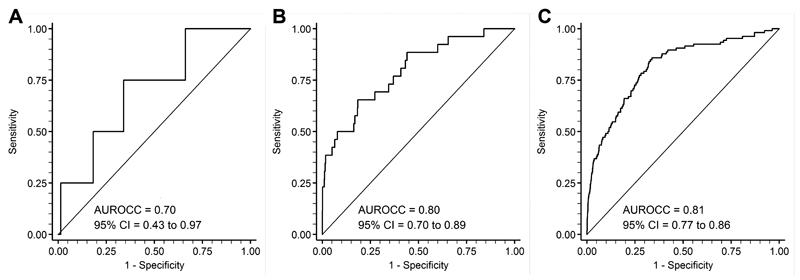
Figure 1.
Receiver operating characteristic curve analysis of the relationship between A. sFlt-1:PlGF ratio at 20wkGA and (i) preeclampsia with delivery prior to 28wkGA or (ii) preeclampsia with delivery prior to 37 weeks where the onset of hypertension was prior to 28wkGA (n=4), B. sFlt-1:PlGF at 28wkGA and preeclampsia leading to preterm birth (n=26), and C. sFlt-1:PlGF at 36wkGA and severe preeclampsia (n=106). The continuous sFlt-1:PlGF ratio is used and the area under the receiver operating characteristic curve (AUROCC) with 95% confidence interval (CI) is given for each analysis.

