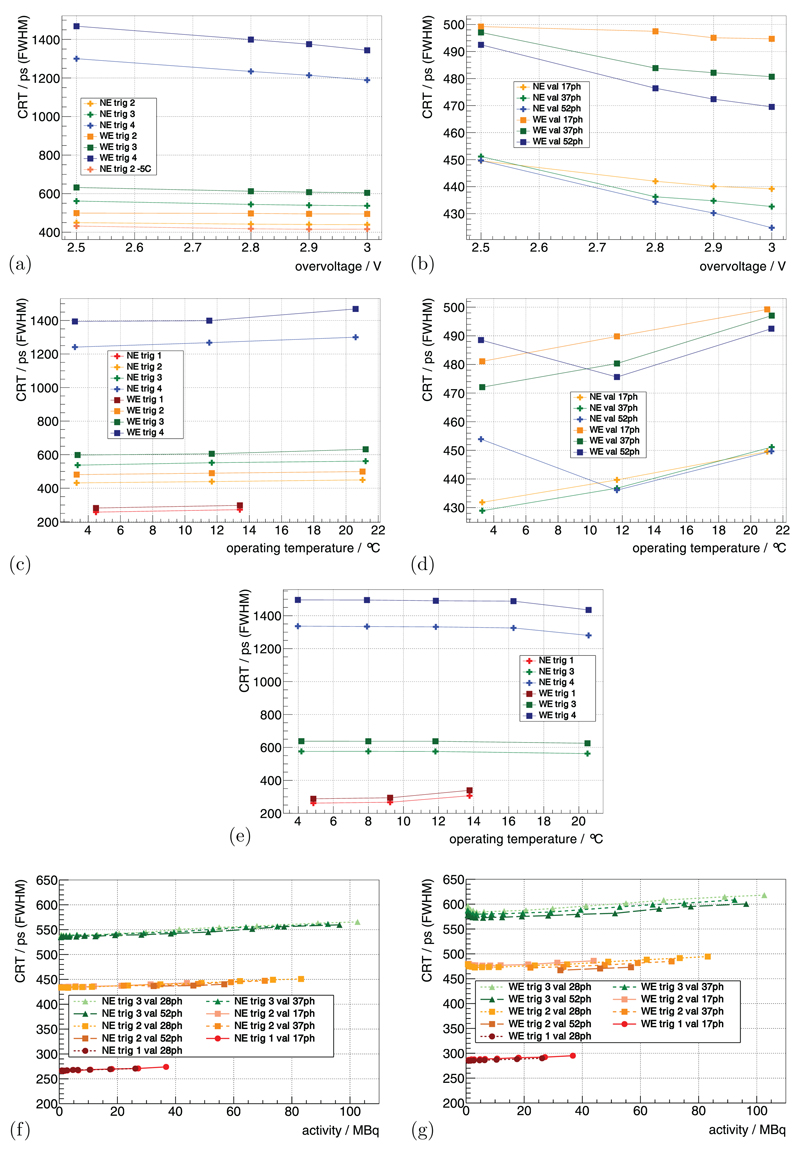
Figure 6.
The CRT measured with the 22Na point sources is shown in (a) as a function of Vov for different trig and in (b) for different val. It is shown for a constant Vbias as a function of Top in (c) for different trig and in (d) for different val. For a constant Vov, it is shown as a function of Top in (e) for different trig. Measured with the FDG-filled scatter phantom, it is shown in (f) and (g) as a function of activity for different trig and val. (a) TC = 15 °C, val | 7ph. (b) TC = 15 °C, trig 2. (c) const Vbias, Vov(TC = 15 °C) = 2.5 V, val | 7ph. (d) const Vbias, Vov(TC = 15 °C) = 2.5 V, trig 2. (e) const Vov(TC) = 2.5 V, val | 7ph. (f) TC = 0 °C, Vov = 2.5 V. (g) TC = 0 °C, Vov = 2.5 V.

