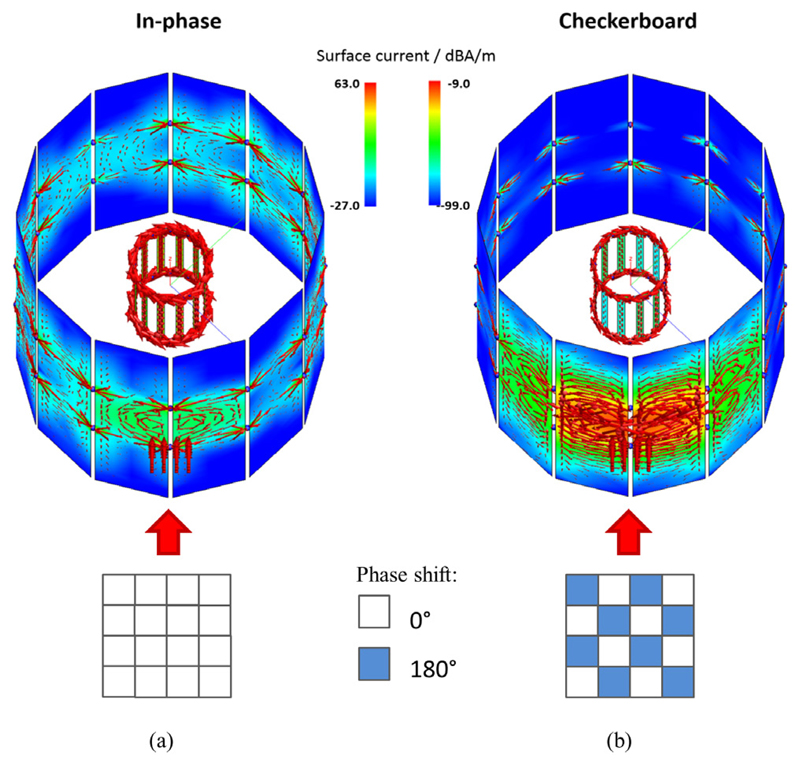
Figure 12.
Simulated surface current distributions of the RF screen and the coil resulting from field emission by dipoles (visualised as red arrows) in front of the RF screen. (a) Field pattern generated by the in-phase pattern leads to distribution over entire the RF screen. (b) Checkerboard-pattern-related field emission yields a localised current distribution.

