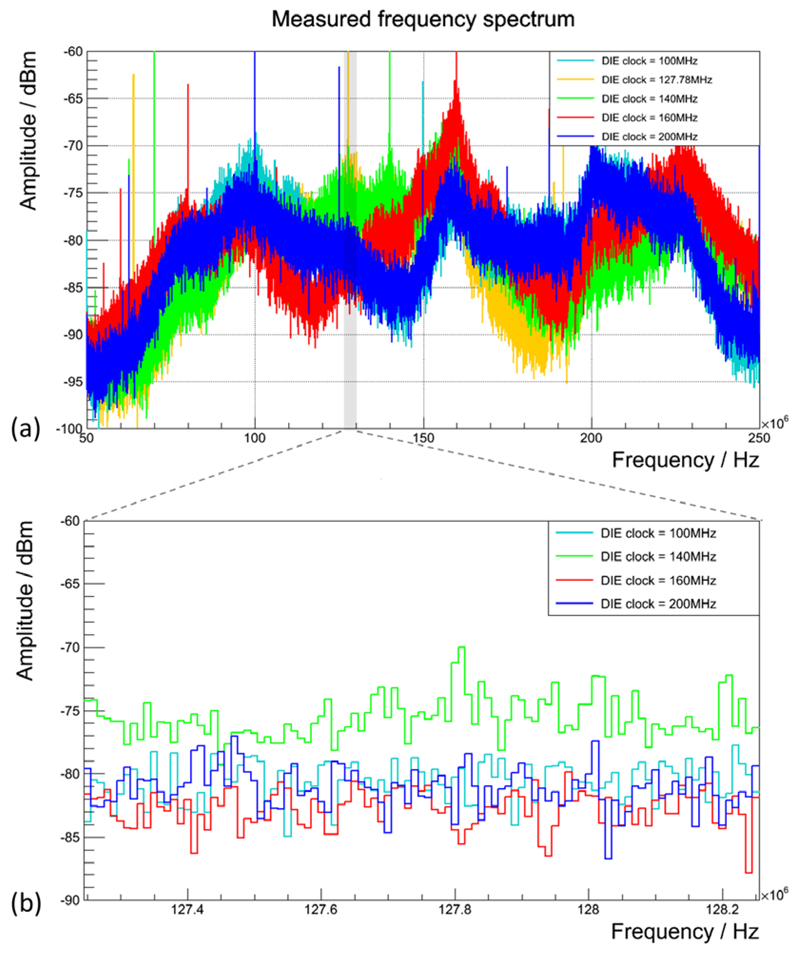
Figure 14.
EM emission of the SDM measured with a spectrum analyser for different sensor die clock frequencies. (a) The broadband measurement with the sensitive bandwidth of the 3 T MRI highlighted by the grey-shaded area around 127.78 MHz. (b) The laboratory bench results for a frequency range within the 3 T-MRI-sensitive bandwidth excluding the die clock frequency equal to the Larmor frequency for the worst-case scenario.

