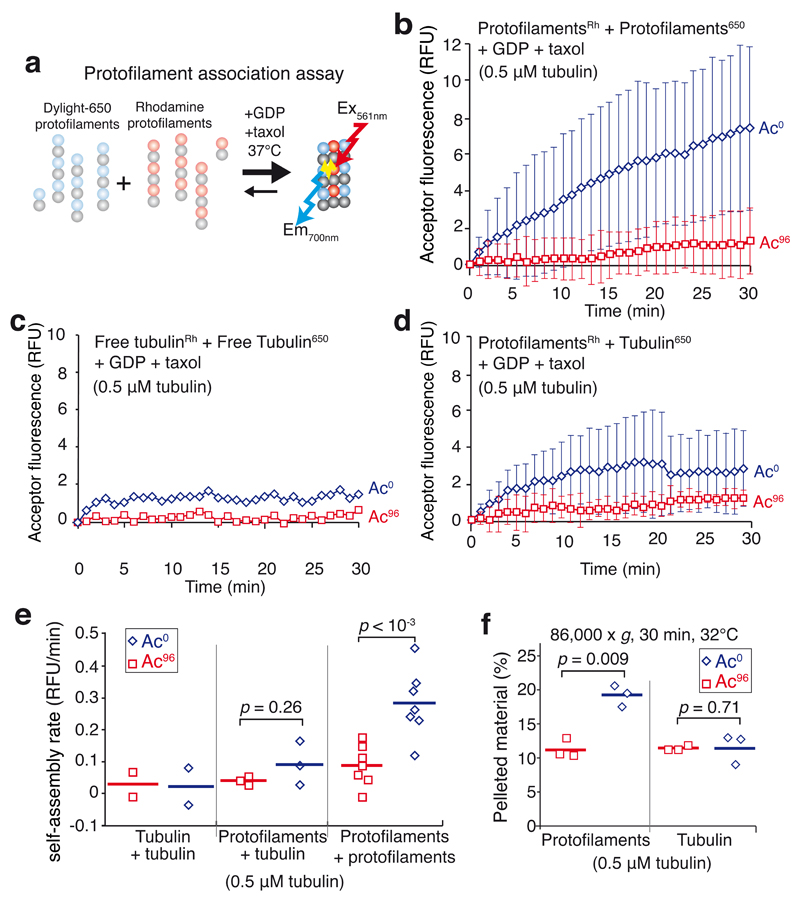
Figure 3. αK40 acetylations.
a, Diagram of the FRET-based protofilament association assay. Two populations of taxol-stabilized protofilaments were mixed together in the presence of taxol and GDP at 37°C and self-association was followed by monitoring the fluorescence transferred between protofilaments. b-d, Self-assembly was assayed in the presence of 1 mM GDP and 0.5 μM taxol at 32°C. FRET was followed in a spectrofluorimeter by exciting rhodamine at 561 nm and measuring DyLight 650 emission at 700 nm. (b) Rhodamine-labeled protofilaments were mixed with DyLight 650-labeled protofilaments (each made with a molar ratio of 90% unlabeled tubulin to 10% labeled tubulin). Data points are mean ± SEM. n = 7 independent experiments for both Ac96 and Ac0 tubulin. (c) Rhodamine- and DyLight 650-labeled tubulin stocks were mixed with unlabeled tubulin so that 10% of the tubulin was rhodamine-labeled and 10% DyLight 650-labeled. Data points are mean of n = 2 experiments for both Ac96 and Ac0 tubulin. (d) Protofilaments (molar ratio of 90% unlabeled tubulin to 10% rhodamine-labeled tubulin) were mixed with free tubulin (molar ratio of 95% unlabeled tubulin to 5% DyLight 650-labeled tubulin) to mimic the free tubulin left in solution after protofilament assembly. Data points are mean ± SEM. n = 3 independent experiments for both Ac96 and Ac0 tubulin. e, Dot plot of the self-assembly rates for free tubulin, free tubulin with protofilaments or protofilaments incubated in the presence of 1 mM GDP and 0.5 μM taxol at 32°C. The bar denotes the mean. Total tubulin concentration was 0.5 μM. The p-values of the two-tailed unpaired Student’s t-tests are indicated. f, Dot plot of the amount of tubulin pelleted at 86,000 x gave for 30 min at 32°C as a result of the association amongst Ac0 or Ac96 protofilaments (n=3 independent experiments). The bar denotes the mean. The p-values of the two-tailed unpaired Student’s t-tests are indicated. Source data for 3c and 3d can be found in Supplementary Table 1.

