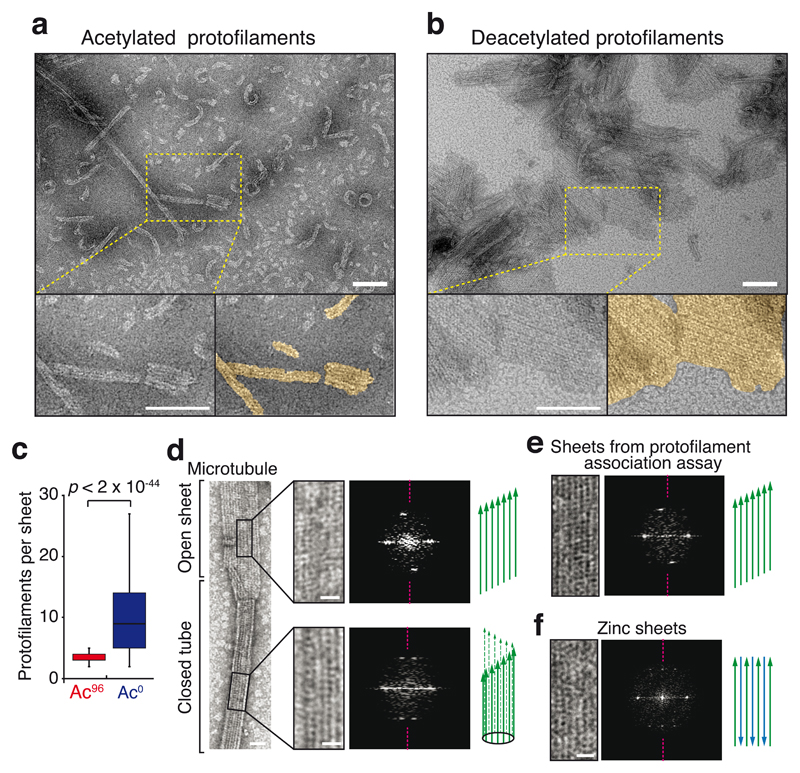
Figure 4. The protofilament interaction assay produces parallel sheets.
a,b, EM micrographs of the protofilaments interaction assays (images are representative of 2 independent experiments). Protofilaments were incubated at 32°C for 30 min with 0.5 μM taxol and 1 mM GDP, and imaged by negative-stain EM. The few sheets observed with Ac96 protofilaments contained only 2 to 5 protofilaments (a), while extended sheets are seen with Ac0 protofilaments (b). Scale bar = 100 nm. Protofilaments sheets are highlighted in gold color in the magnified bottom right panel of (a) and (b). Scale bar: 100 nm. c, Box plots of the width of sheets (expressed in contiguous protofilament numbers) formed by the association of Ac0 or Ac96 protofilaments. n = 361 Ac96 protofilaments and n = 382 Ac0 protofilaments (pooled from 2 independent experiments). The box represents the 25th-75th percentile, whiskers indicate 1.5 times the range, bar in the middle is the median d-f, Negative stain EM images and associated diffraction patterns; magenta dashed lines indicate the meridian of the diffraction pattern. d, The closed microtubule lattice and its diffraction pattern is shown in the bottom right panels while the open sheet and its diffraction patterns is shown on the top right panels. e, Protofilament sheet and its diffraction patterns from the protofilament self-assembly assay. f, Antiparallel protofilament sheet assembled in presence of zinc. Scale bars: 25 nm (full size images), 10 nm (magnified insets). Diagrams illustrate the known and deducted protofilaments organization. The experiments presented in d and f were performed once, and the experiment in e twice.

