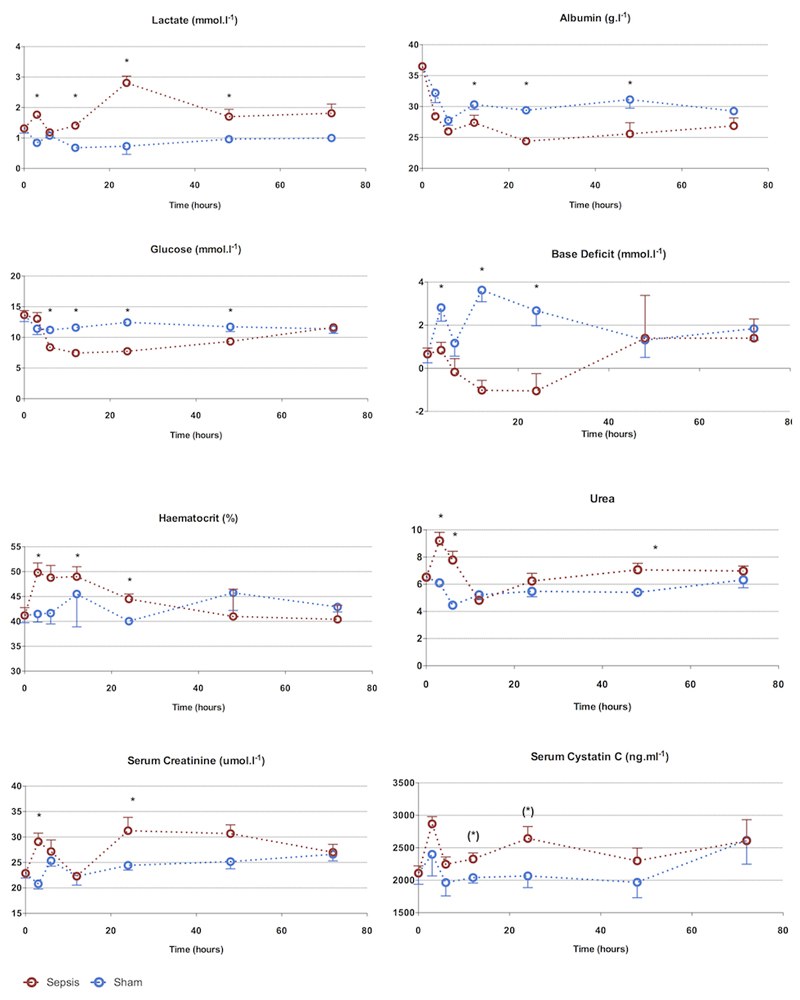
Figure 2. 72-hour characterization of sepsis and recovery phases - biochemistry.
Biochemical changes occur from 3h. Apart from serum urea, changes are maximal at 24h followed by recovery to baseline values at 72h. The early rise in urea, creatinine, and lactate is corrected after fluid resuscitation, demonstrating early hemoconcentration.
Points and whiskers represent median and interquartile range respectively. (*: p<0.05 sham vs sepsis; (*): p=0.05-0.06 sham vs sepsis)

