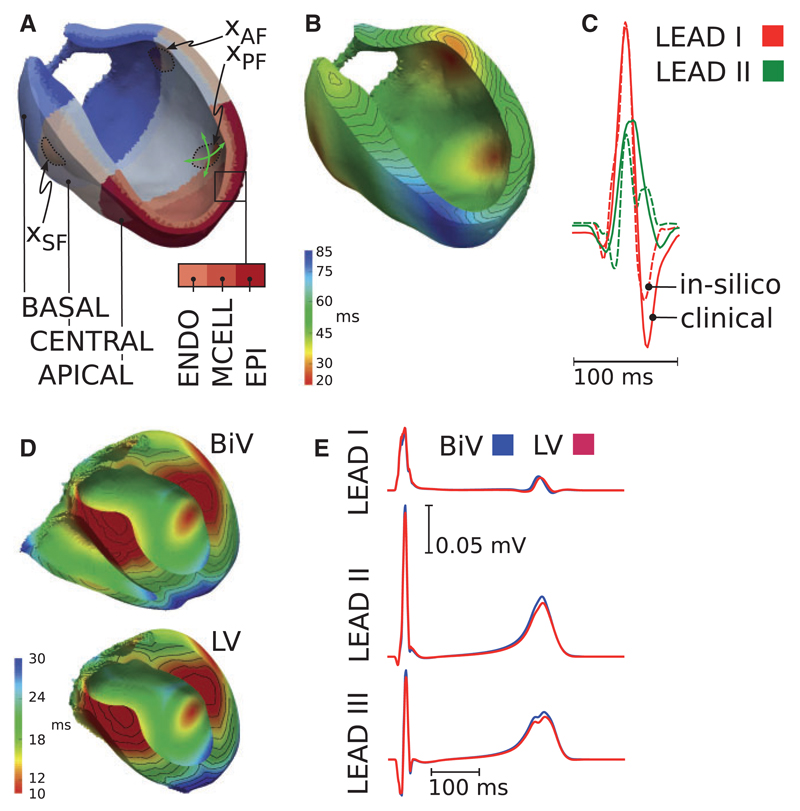
Figure 2.
LV model: (A) chosen sites of earliest activation at anatomical locations of the septal (xSF), anterior (xAF) and posterior (xPF) fascicles. (B) Simulated activation sequence. (C) Comparison of computed (dashed line) and measured (solid line) ECGs. BiV model: (D) simulated activation sequence for the BiV (top) and reduced LV (bottom) model. (E) Influence of the RV on the ECG. Computed ECGs are shown for the BiV (blue) and the LV (red) models.

