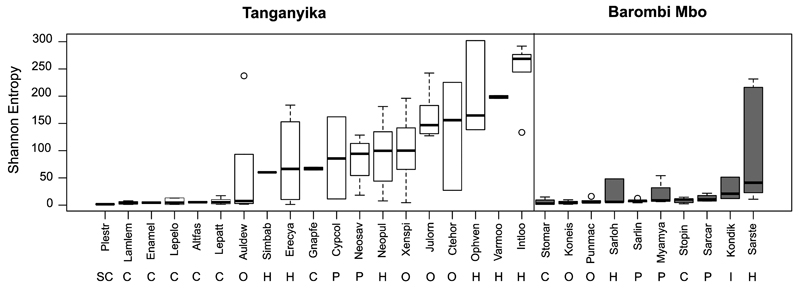
Figure 3. Alpha diversity by species as effective number of OTUs (Shannon Entropy).
Boxplots summarize values of alpha diversity per species calculated as Shannon entropy on collated results after multiple rarefactions at a maximum depth of 13730 reads (1000 reads step, 10 iterations). Boxplots are centered at and ordered by the median, while whiskers show data dispersion across conspecifics.
Diversity can be substantially high at intraspecific level for some species, while remarkably low in others (mostly carnivores). A clear trend is seen as a function of diet at both lakes, with carnivores showing a highly depleted diversity compared to herbivores. Removal of either poorly represented OTUs (<10 reads total) or selective inclusion only of the three main phyla (Firmicutes, Fusobacteria and Proteobacteria) provided a comparable pattern of alpha-diversity across species.

