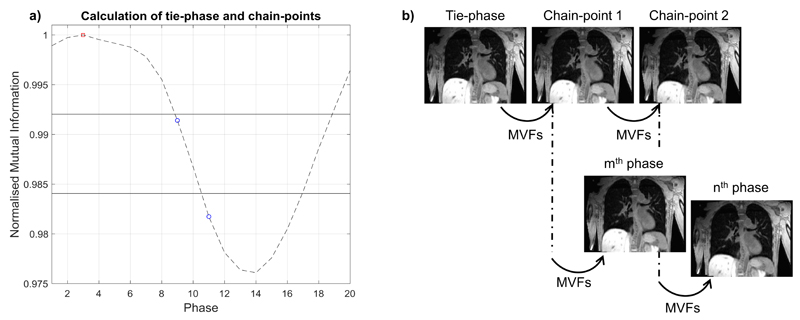
Figure 2.
a) Displays the image similarity signal with the tie-point phase (red square) and chain-point phases (blue circles). The values (horizontal solid lines) of the fractions of the signal range, used to calculate the chain-point phases, are shown. b) The volumes corresponding to the chain-point phases are determined by sequentially warping the tie-phase with the required motion vector fields (MVF)s. The chain-point phases are used as a starting point to generate any arbitrary phase. For instance, the mth phase is calculated with two deformations (Tie-phase → Chain-point 1; Chain-point 1 → mth phase) and the nth phase requires three deformations (Tie-phase → Chain-point 1; Chain-point 1 → Chain-point 2; Chain-point 2 → nth phase).

