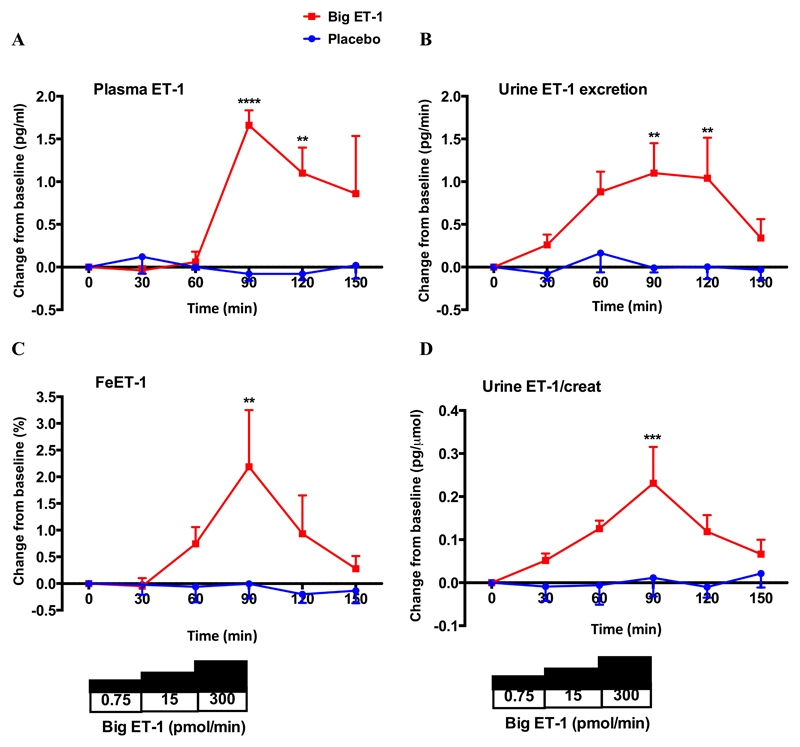
Figure 1. Change in plasma and urinary ET-1.
Change from baseline ± SEM in plasma ET-1 (A), urinary ET-1 excretion (B), fractional excretion of ET-1 (FeET-1) (C) and urine ET-1/creat following treatment with placebo (blue line) and big ET-1 (red line). **p <0.01, ***p <0.001 and ****p <0.0001 for placebo vs. big ET-1 (ANOVA plus Bonferroni correction for significance at specific time points).

