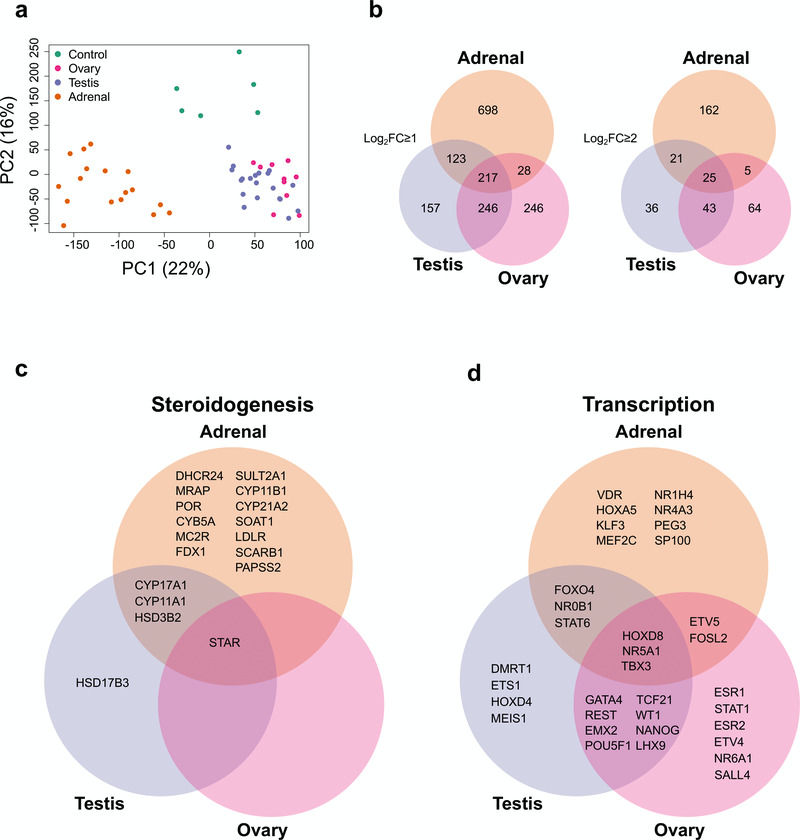
Figure 2. Differential gene expression in adrenal gland, testis and ovary compared to controls.
(a) Principal component analysis of the 53 samples included in the study (17 adrenal, 20 testes, 10 ovary and 6 controls). The scatter plot shows the position of samples based on the two first principal components (PC1, PC2). (b) Venn diagram showing the overlap between differentially up-regulated genes in the adrenal, testis and ovary compared with control samples using either log2FC≥1 or log2FC≥2. (c) Selected examples of differentially up-regulated genes (log2FC≥2) involved in steroidogenesis (d) Selected transcription factors differentially expressed in each tissue (log2FC≥1). For all comparisons, P-value≤0.05.

