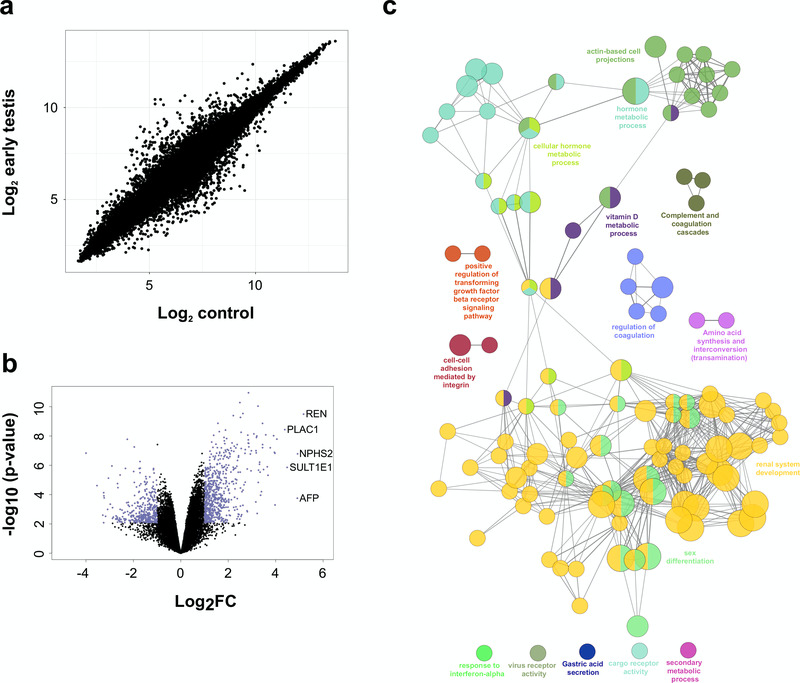
Figure 7. Differentially expressed genes in the early testis compared to control samples.
(a) Correlation plot for log2 mean gene expression levels in the early testis (CS18 to CS19) (N=4) versus control samples (N=6) (Pearson’s product-moment correlation test correlation coefficient=0.968, P-value≤ 2.2e-16). (b) Volcano plot for the differentially expressed genes in early testis versus control samples. Purple colour indicates genes with absolute log2FC≥1 and P-value≤ 0.05. (c) Pathway-enrichment analysis using ClueGO for differentially expressed up-regulated pathways in early testis compared to control samples (log2FC≥1, P-value≤0.005).

