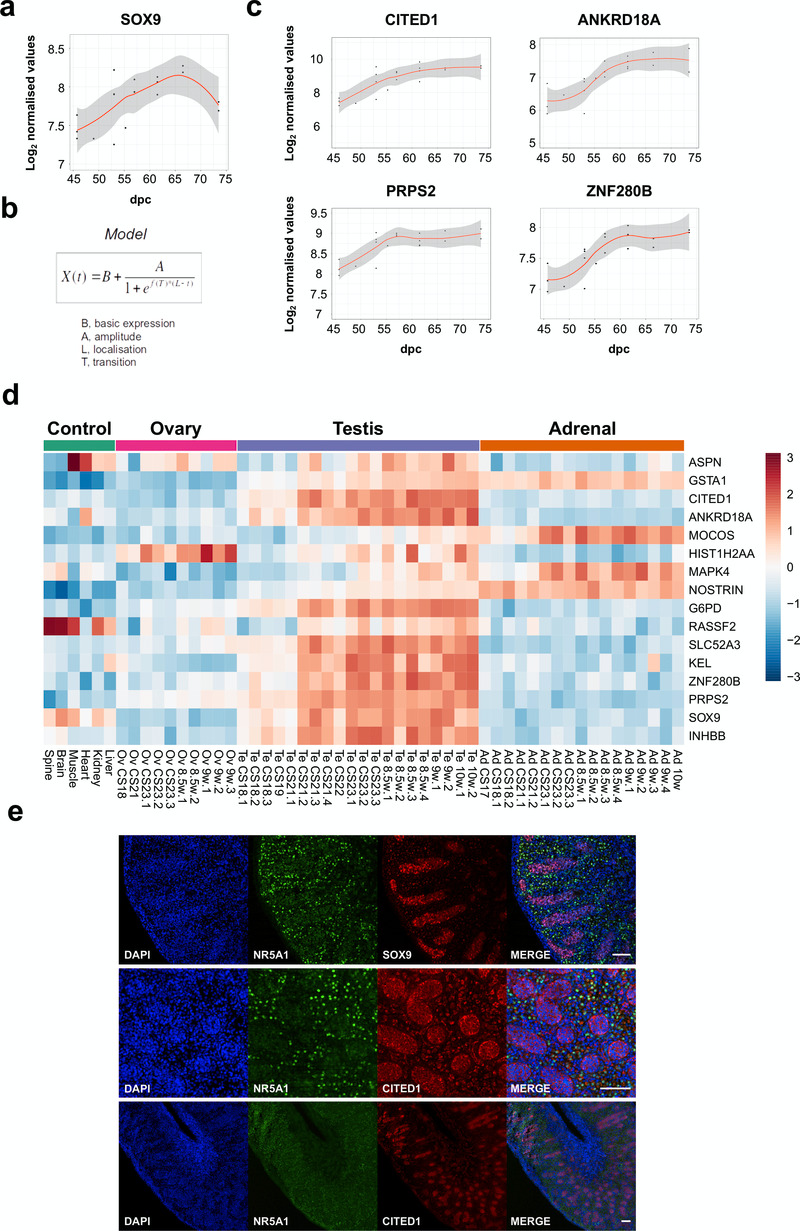
Figure 8. Identification of potential genes downstream of SRY using the BALT model.
(a) Scatter plot showing curvilinear upregulation of SOX9 during testis development (45 to 74 dpc). Loess method was used for fitting a smooth curve between variables. (b) Equation used in the BALT mathematical model (see methods for details). (c) Scatter plots showing changes in gene expression patterns for CITED1, ANKRD18A, PRPS2 and ZNF280B in the developing testis (45 to 74 dpc). Loess method was used for fitting a smooth curve between variables. (d) Heatmap representing normalised gene expression values for genes showing similar expression patterns to SOX9, based on the BALT mathematical model. The intensity of gene expression is indicated by a colour scale: blue for lowest and red for highest expression levels. For all samples shown, P-value≤0.005. (e) Immunohistochemistry for NR5A1 (SF-1, staining Leydig cells), SOX9, and CITED1 in the human fetal testis (11 wpc). Nuclei are counterstained blue with DAPI. Scale bars, 100 µm.

