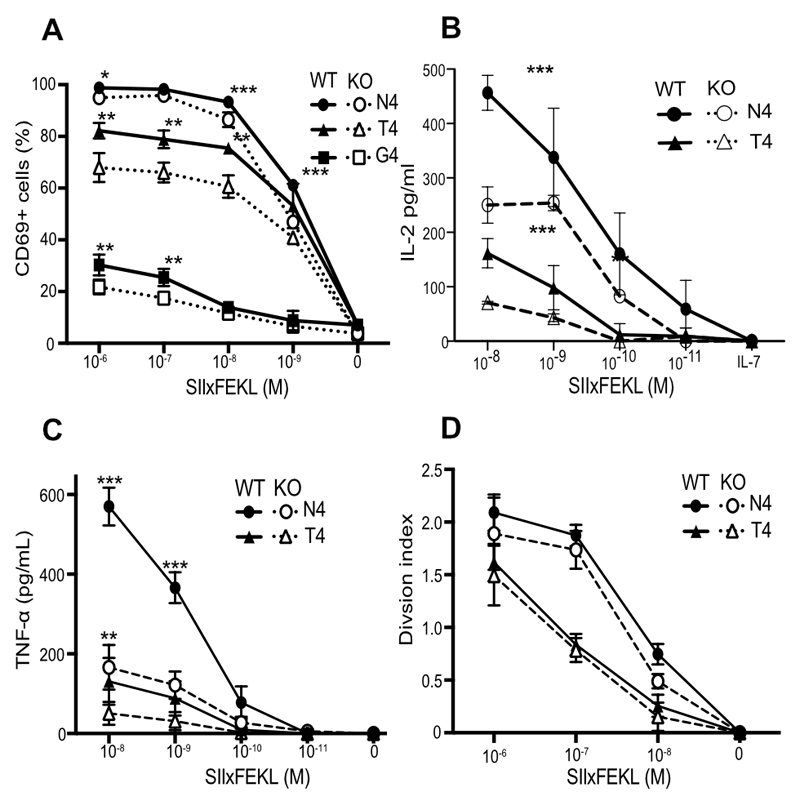
Figure 2. Cav1 regulates CD8 T cell responses to antigen.
(A) The frequency of CD69+ cells among Cav1-WT and Cav1-KO OT-1 CD8 T cells stimulated for 3 h with a titration of N4, T4 or G4 peptides. (B) and (C) Cav1-WT and Cav1-KO OT-1 CD8 T cells were stimulated and supernatants were assayed at 24h for total IL-2 (B) and TNF-α (C) by ELISA. (D) Proliferation at 72 h of CTV-labeled OT-1 T cells is represented by the division index calculated using FlowJo software. Data representative of 2 independent experiments, each performed on 3 mice per group. Error bars represent SD, *p ≤0.05, **p ≤0.01, *** p ≤0.001 (Student’s t-test, corrected for multiple comparisons using the Holm-Sidak method).

