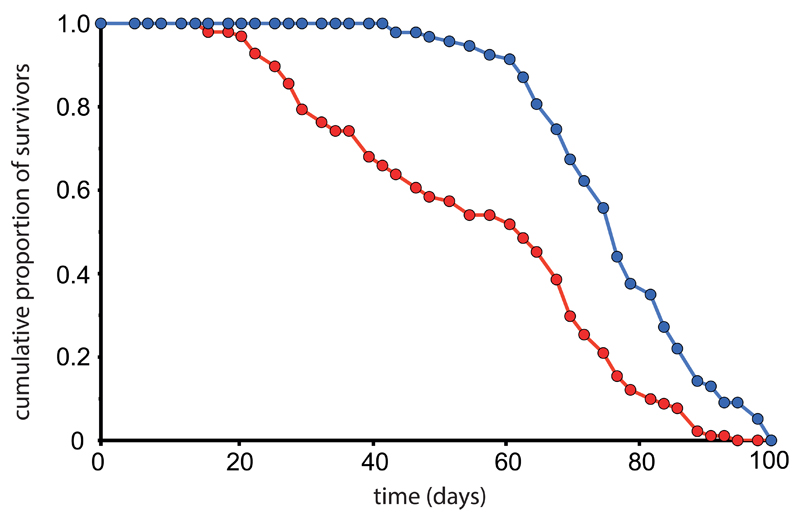
Figure 1.
Examples of good and poor quality survival data. The survival characteristics of a healthy population of flies is demonstrated in blue. There are relatively few deaths up until day 60, from which point there is rapid loss of life. By contrast, the population illustrated by the red line suffers substantial numbers of deaths beginning at day 20. Thus many flies are dying at young and middle ages, rather than predominantly at old age. This is a sign of poor housing conditions or a genetically fragile stock.

